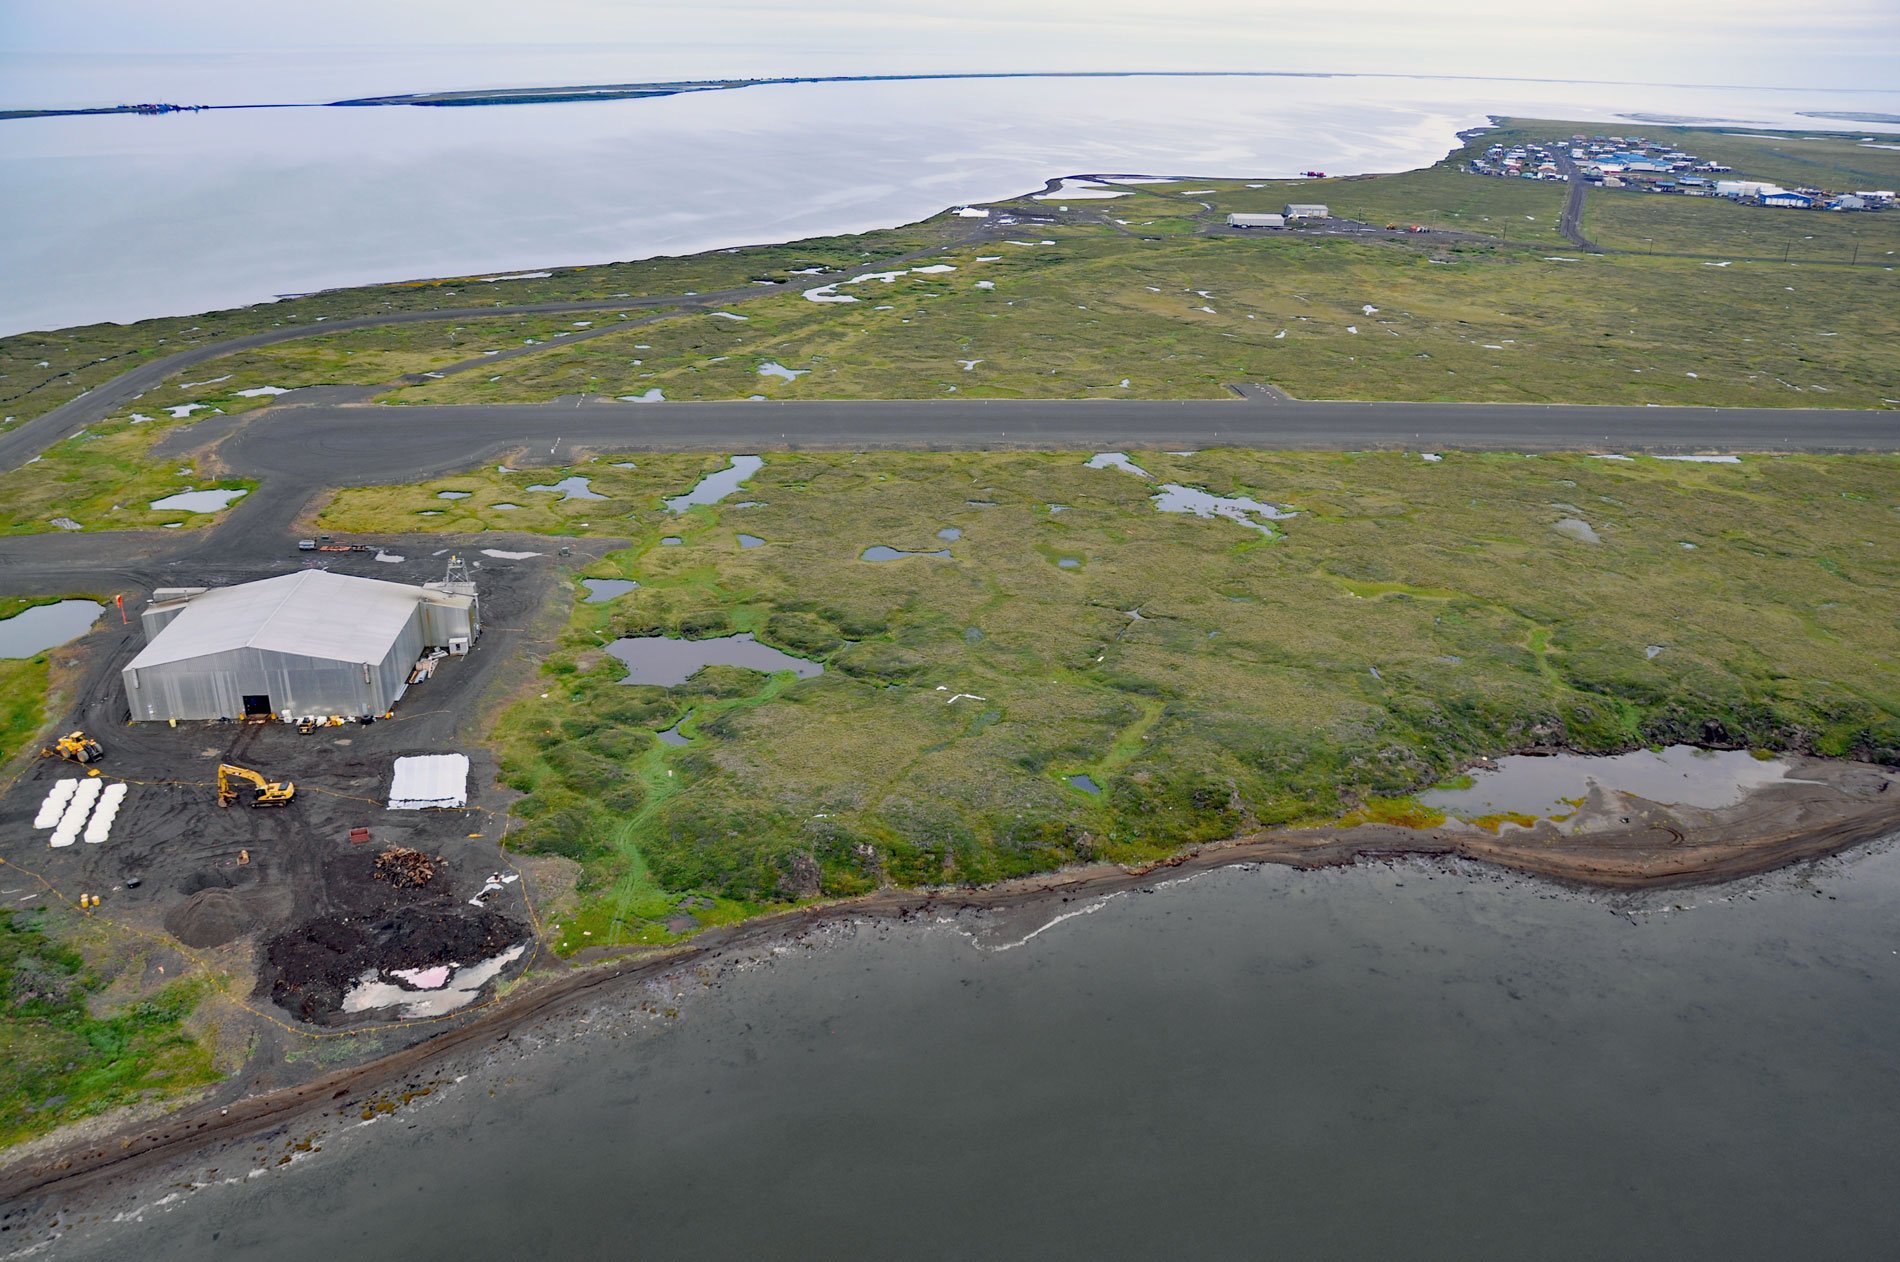
Point Lay Village is a community at the mouth of the Kokolik River on Kasegaluk Lagoon, about 94 miles (152 km) southwest of Wainwright and 134 miles (216 km) northeast of Point Hope, Alaska. Kasegaluk Lagoon is isolated from the Chukchi Sea by a series of long thin barrier islands separated by 7 passes. The lagoon receives the waters from the Kukpowruk and Utukok Rivers and at Point Lay the Kokolik River. Kokolik River starts in the De Long Mountains and flows northwest for 200 miles (323 km) to Kasegaluk Lagoon. The Iñupiat name for the river was first reported in 1898 by Lieutenant David H. Jarvis of the U.S. Revenue Cutter Service. Kokolik refers to the bistort, an edible flowering plant that is abundant in the Arctic.
The village of Point Lay is one of the more recently established Iñupiat villages on the Arctic coast, although historically the original barrier island site was occupied by a small group of one or two families. They were joined in 1929-30 by several more families from Point Hope. The deeply indented shoreline has prevented effective bowhead whaling, but the village participates in beluga whaling. In 1974, the village moved from the historical barrier island site to the mainland. The old village site is now used as a summer hunting camp. In the late 1970s, due to seasonal flooding from the Kokolik River, the village relocated again to a site near the Distance Early Warning station.
The Point Lay military base was part of the Distant Early Warning (DEW) Line radar network, a system of defensive installations active during the Cold War. The Point Lay facility was established in 1955 and was also part of the Alaska Radar System. The operation ended in 1989 and was deactivated in 1994. The radar dishes were removed between 2004 and 2006. A gravel runway and maintenance buildings remain. Read more here and here. Explore more of Point Lay and Kokolik River here:

