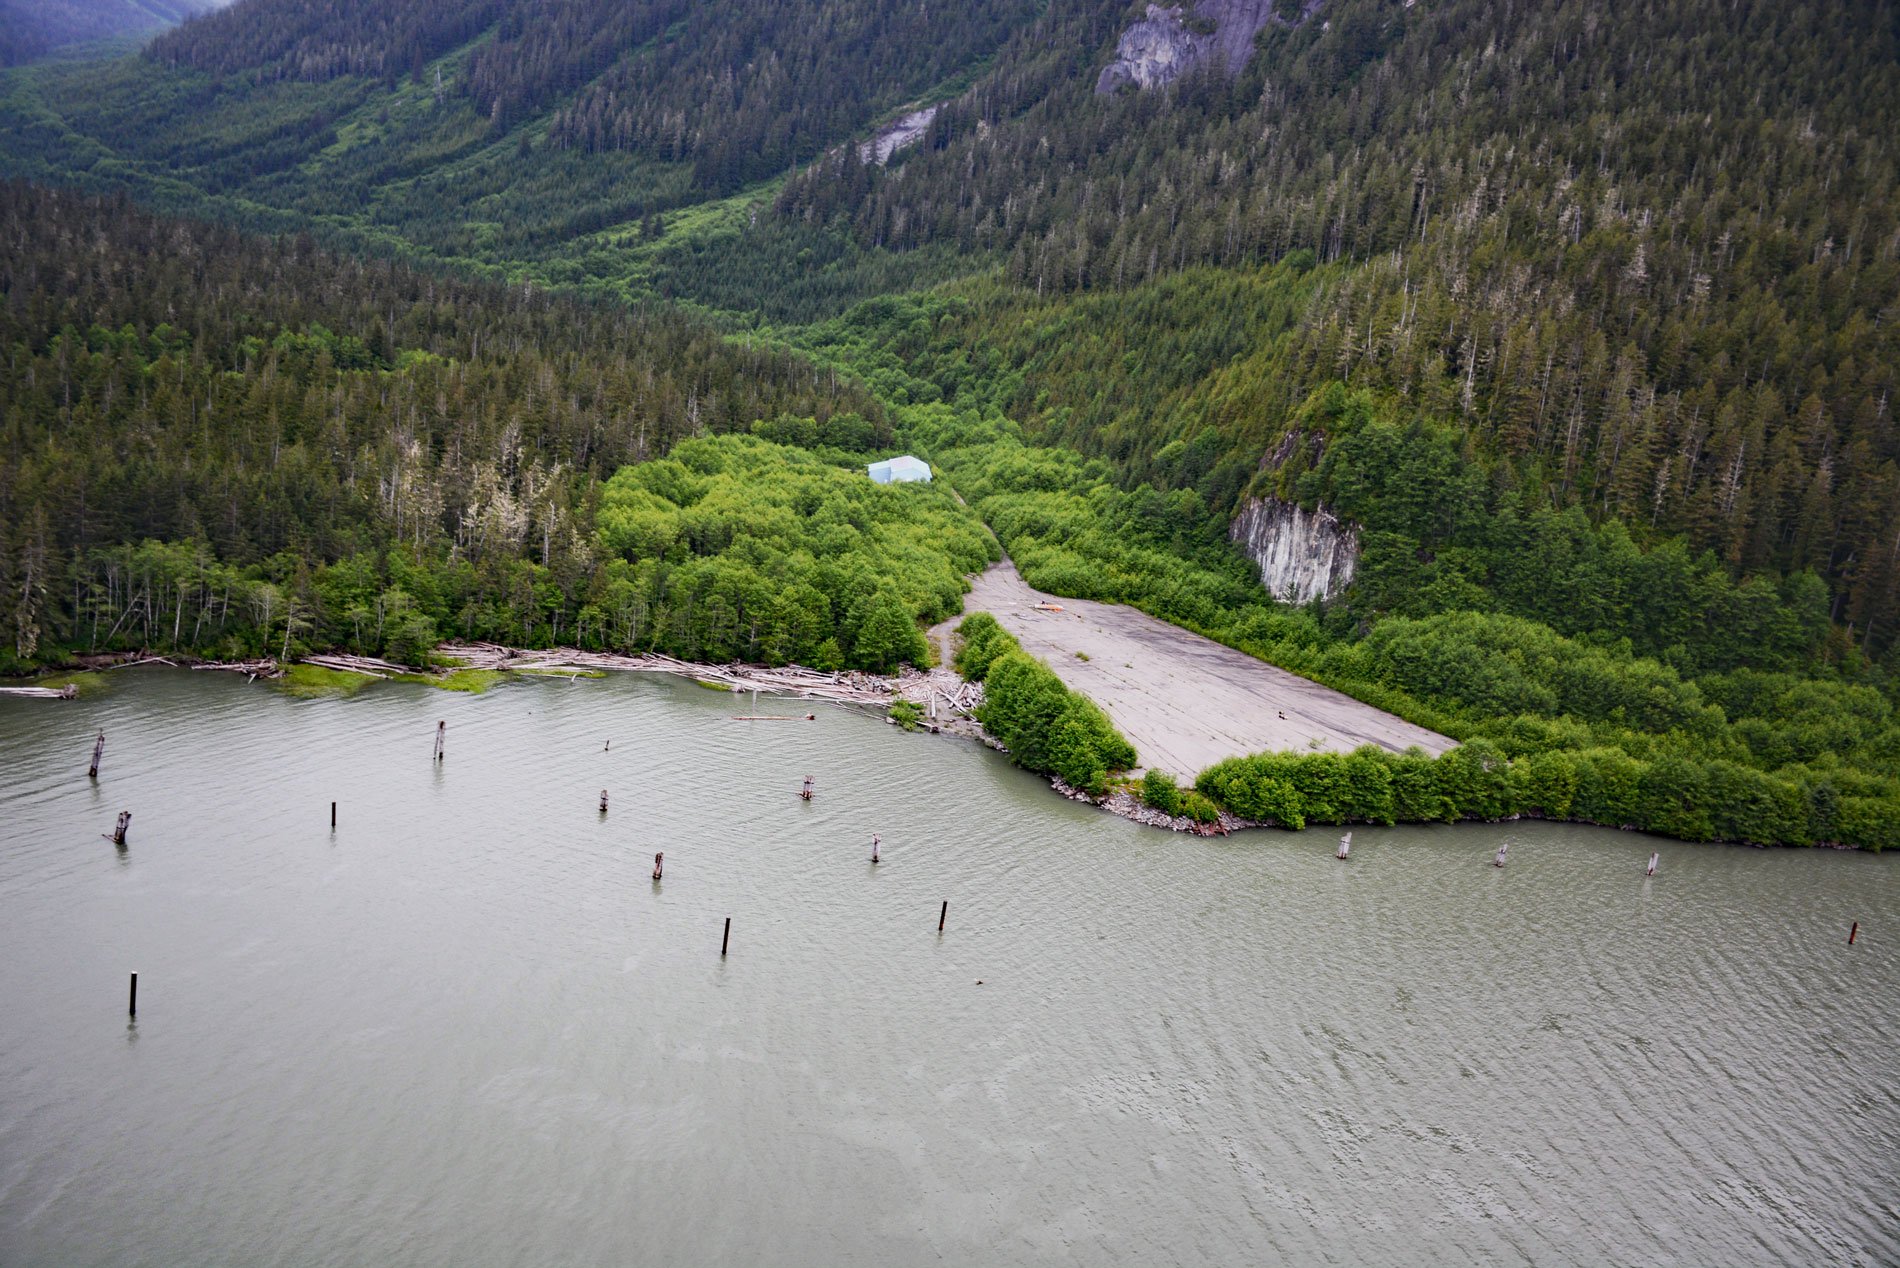
Scotia River starts at an elevation of 5,023 feet (1,531 m) in the Coast Range and flows generally north-northwest for 14 miles (22 km) through the Great Bear Rainforest, draining a watershed of 33,360 acres (13,500 ha) to the southern shore, or left bank, of the Skeena River, about 49 miles (79 km) southwest of Terrace and 29 miles (47 km) east-southeast of Prince Rupert, British Columbia. The watershed lies along the boundary between the Coast Range Batholith to the west and the Intermontane Belt to the east. These zones represent volcanic flows and volcanogenic sediments that accumulated to great thicknesses in subsiding basins during Paleozoic and Mesozoic times. The Coast Range Batholith consists mainly of Paleozoic to Paleogene granitic rocks and Proterozoic to Paleozoic high-grade metamorphic rocks. The Intermontane Belt is dominated by sedimentary and volcanic rocks of early Jurassic to Cretaceous age, intruded by Jurassic and late Cretaceous to early Paleogene felsitic to porphyritic magma plugs.
The Scotia River watershed was reshaped by repeated Pleistocene glaciations and now has the classic U-shaped valley with a broad lower river floodplain supporting a riparian habitat of mostly mature forest. Logging in the watershed started in 1980, first at lower elevations where an extensive network of logging roads was constructed, and more recently in upland areas with both conventional and helicopter logging. A logging camp and sorting yard owned by Interfor Corporation and operated by Bear Creek Contracting was located at the confluence of the Scotia and Skeena Rivers. Interfor Corporation is based in Vancouver and has sawmills in British Columbia, Washington, Oregon, Georgia, South Carolina, and Arkansas. Interfor is one of several companies that log old-growth spruce and cedar trees from the Great Bear Rainforest, part of the larger Pacific temperate rainforest ecoregion comprising 15,814,730 acres (6,400,000 ha). The Great Bear Rainforest is one of the largest remaining tracts of unspoiled coastal temperate rainforest left in the world.
In 2016, the Government of British Columbia officially recognized the Great Bear Rainforest, when it announced an agreement to permanently protect 85 percent of the old-growth forested area from industrial logging. The area is home to cougars, wolves, salmon, grizzly bears, and the Kermode bear, a unique subspecies of the black bear. The Scotia River provides important spawning habitat for pink and coho salmon, and steelhead trout. The old-growth forest features 1,000-year-old western red cedar and Sitka spruce over 300 feet (90 m) tall. Coastal temperate rainforests are characterized by their proximity to both the ocean and mountains. Abundant rainfall results when the atmospheric flow of moist air off the ocean collides with mountain ranges. Much of the Pacific coastline of North America share this climate pattern, including portions of Alaska, British Columbia, Washington, Oregon, and Northern California. Read more here and here. Explore more of Scotia River and the Great Bear Rainforest here:

