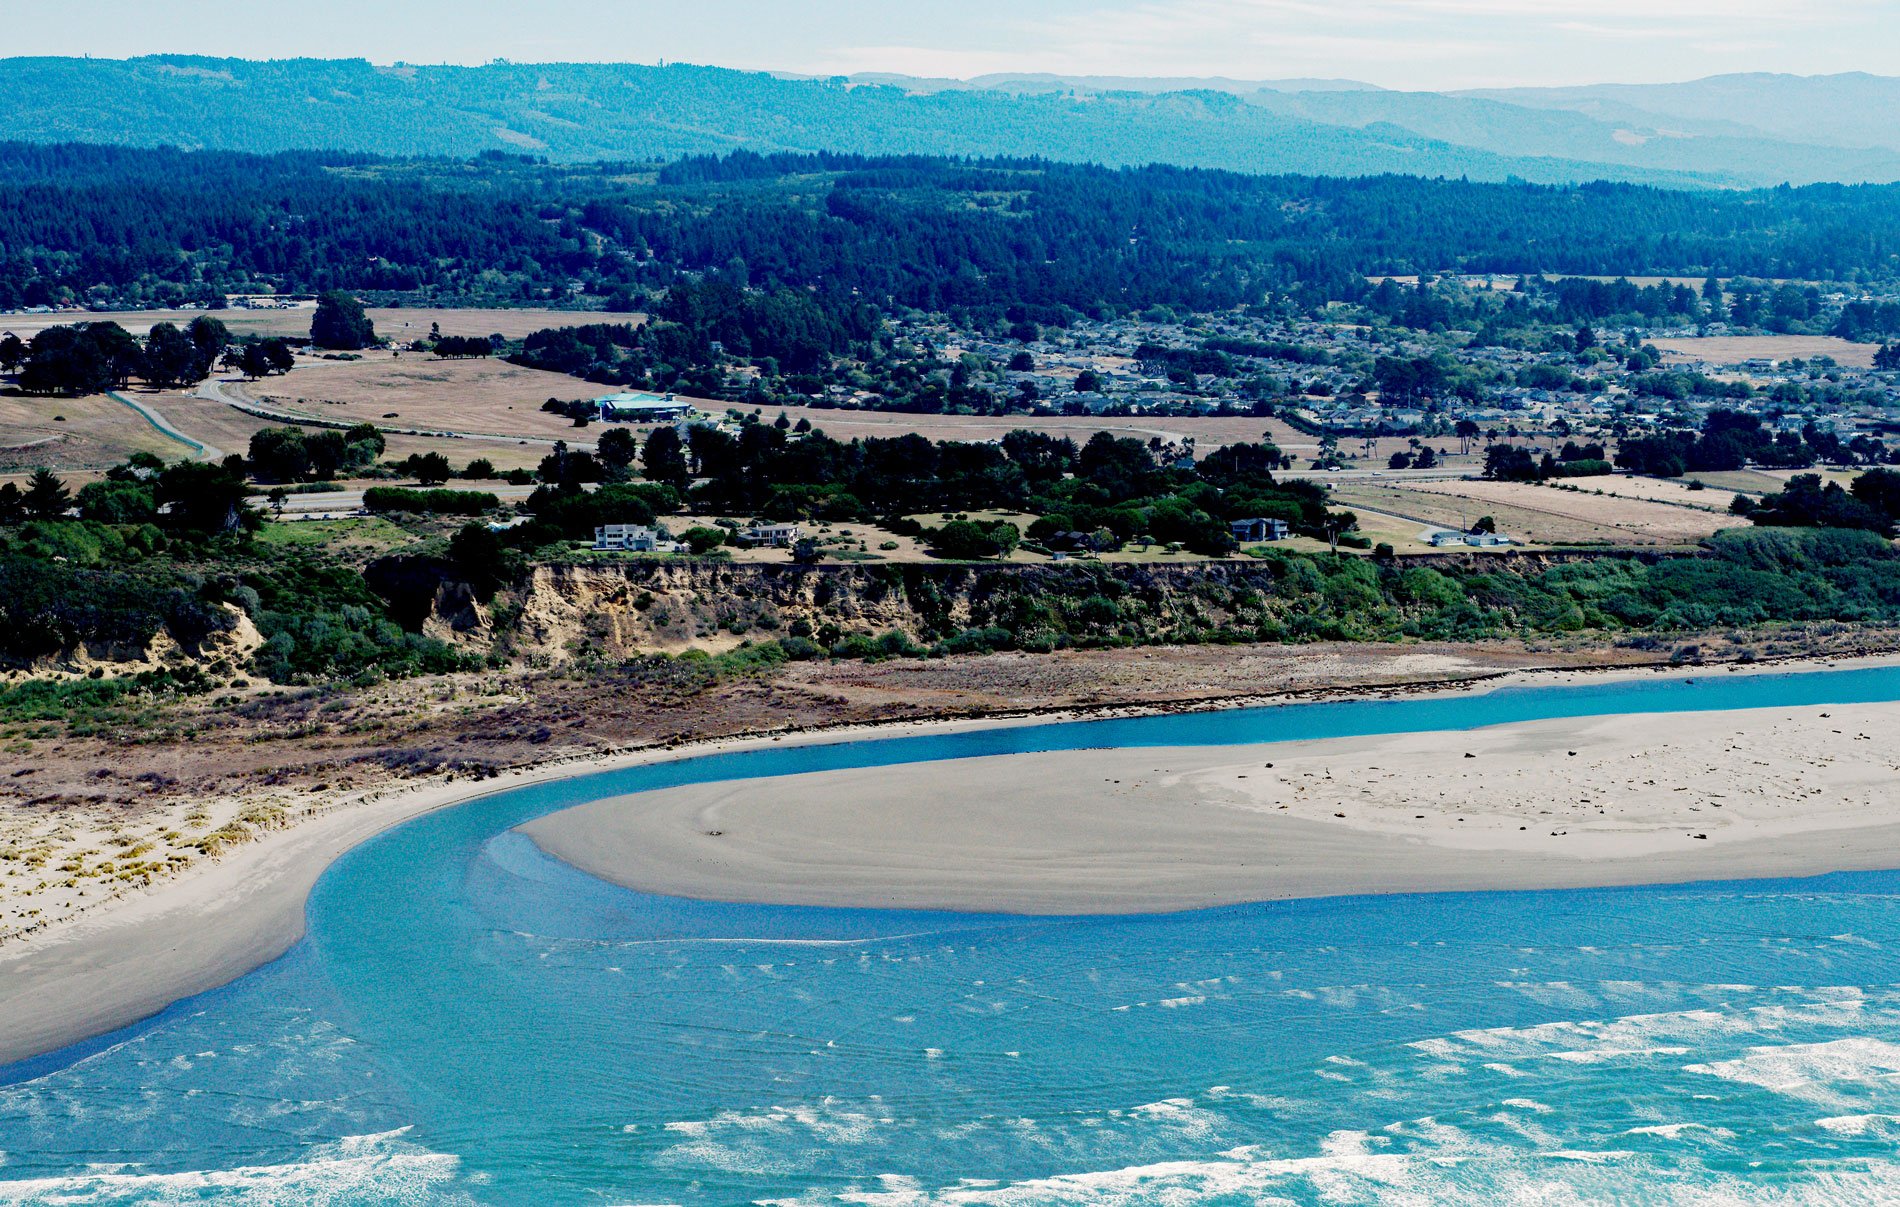
Mad River starts in the Coast Range at an elevation of 4,845 ft (1,477 m) and flows generally northwest for 113 miles (182 km), draining a watershed of 318,080 acres (128,722 ha), and enters the Pacific Ocean about 12 miles (19 km) north of Eureka and 1.8 miles (3 km) northwest of McKinleyville, California. The river is named for an episode that occurred in 1849 when a party of poorly provisioned miners crossed this large river without their leader Josiah Gregg, and the river was named for the ensuing emotional outburst. The watershed is formed mostly by rocks representing the Franciscan Complex that developed during the Cretaceous and Jurassic and consists of a fragmented and highly sheared mélange of sandstone, shale, chert, limestone, and conglomerate. The lower Mad River watershed is underlain by the Falor Formation that developed during the mid-Pleistocene and consists of sand, gravel, and minor deposits of silts and clays. Currently, the river makes a wide northerly sweep and enters an estuary trapped between an alongshore spit roughly 3 miles (5 km) long at the base of Mad River Bluffs.
The lower Mad River watershed is the traditional territory of the Wiyot people, one of two tribes in northern California speaking a dialect of the Algic language. The other tribe is the Yurok who inhabit the adjacent lands to the north along the Pacific coast from present-day Trinidad to Crescent City. The Wiyot and Yurok likely first contacted Europeans when Spanish explorers entered their territory in the 18th century. Fur traders and trappers from the Hudson’s Bay Company came in 1827, followed by Euro-American settlers during a gold rush in 1850. Disease and massacres subsequently reduced their population by 75 percent. The upper Mad River watershed and the adjacent Eel River were controlled by the Whilkut, Nongatl, and Lassik who spoke an Athabascan language. These tribes were essentially annihilated during the Bald Hills War in the 1860s, and today, only the Wiyot and Yurok remain as federally recognized tribes. In the 1860s, Joe Dows settled in the general area known today as Dows Prairie near the mouth of Mad River. Slightly south was a small community called Minor that was also first settled in the late 19th century. Just south of Minor was Calville settled by the employees of the California Barrel Company. After President William McKinley was assassinated in 1901 the community of Minor changed its name to McKinleyville in his honor. Today, all three communities are collectively considered to be part of McKinleyville.
Mad River provides groundwater recharge for agriculture and is free-flowing for 85 percent of its length. The Matthews Dam forms the Ruth Reservoir in the upper watershed near the community of Ruth, about one-third of the way downstream from the headwater source near South Kelsey Ridge. One of the greatest problems for the Mad River watershed is erosion causing increasing sedimentation and turbidity in the river and its tributaries. The main causes of erosion are excessive road building and logging, especially historical logging practices. The removal of riparian vegetation for agriculture, ranching, and urbanization also increases erosion as well as adding pollution from untreated runoff. In 1992, the Mad River was listed under the California Clean Water Act Section as sediment impaired, due to elevated erosion and siltation. In 2006, the river was additionally listed as temperature and turbidity-impaired. An estuary restoration project is underway to remove levees from the floodplain and restore a floodplain and river connection. The left bank of the river mouth above the estuary is currently leveed to protect roadways and grazing pasture. The project will build channels connecting the mainstem to wetland habitat for overwintering Chinook and coho salmon, and steelhead trout. Read more here and here. Explore more of Mad River and McKinleyville here:

