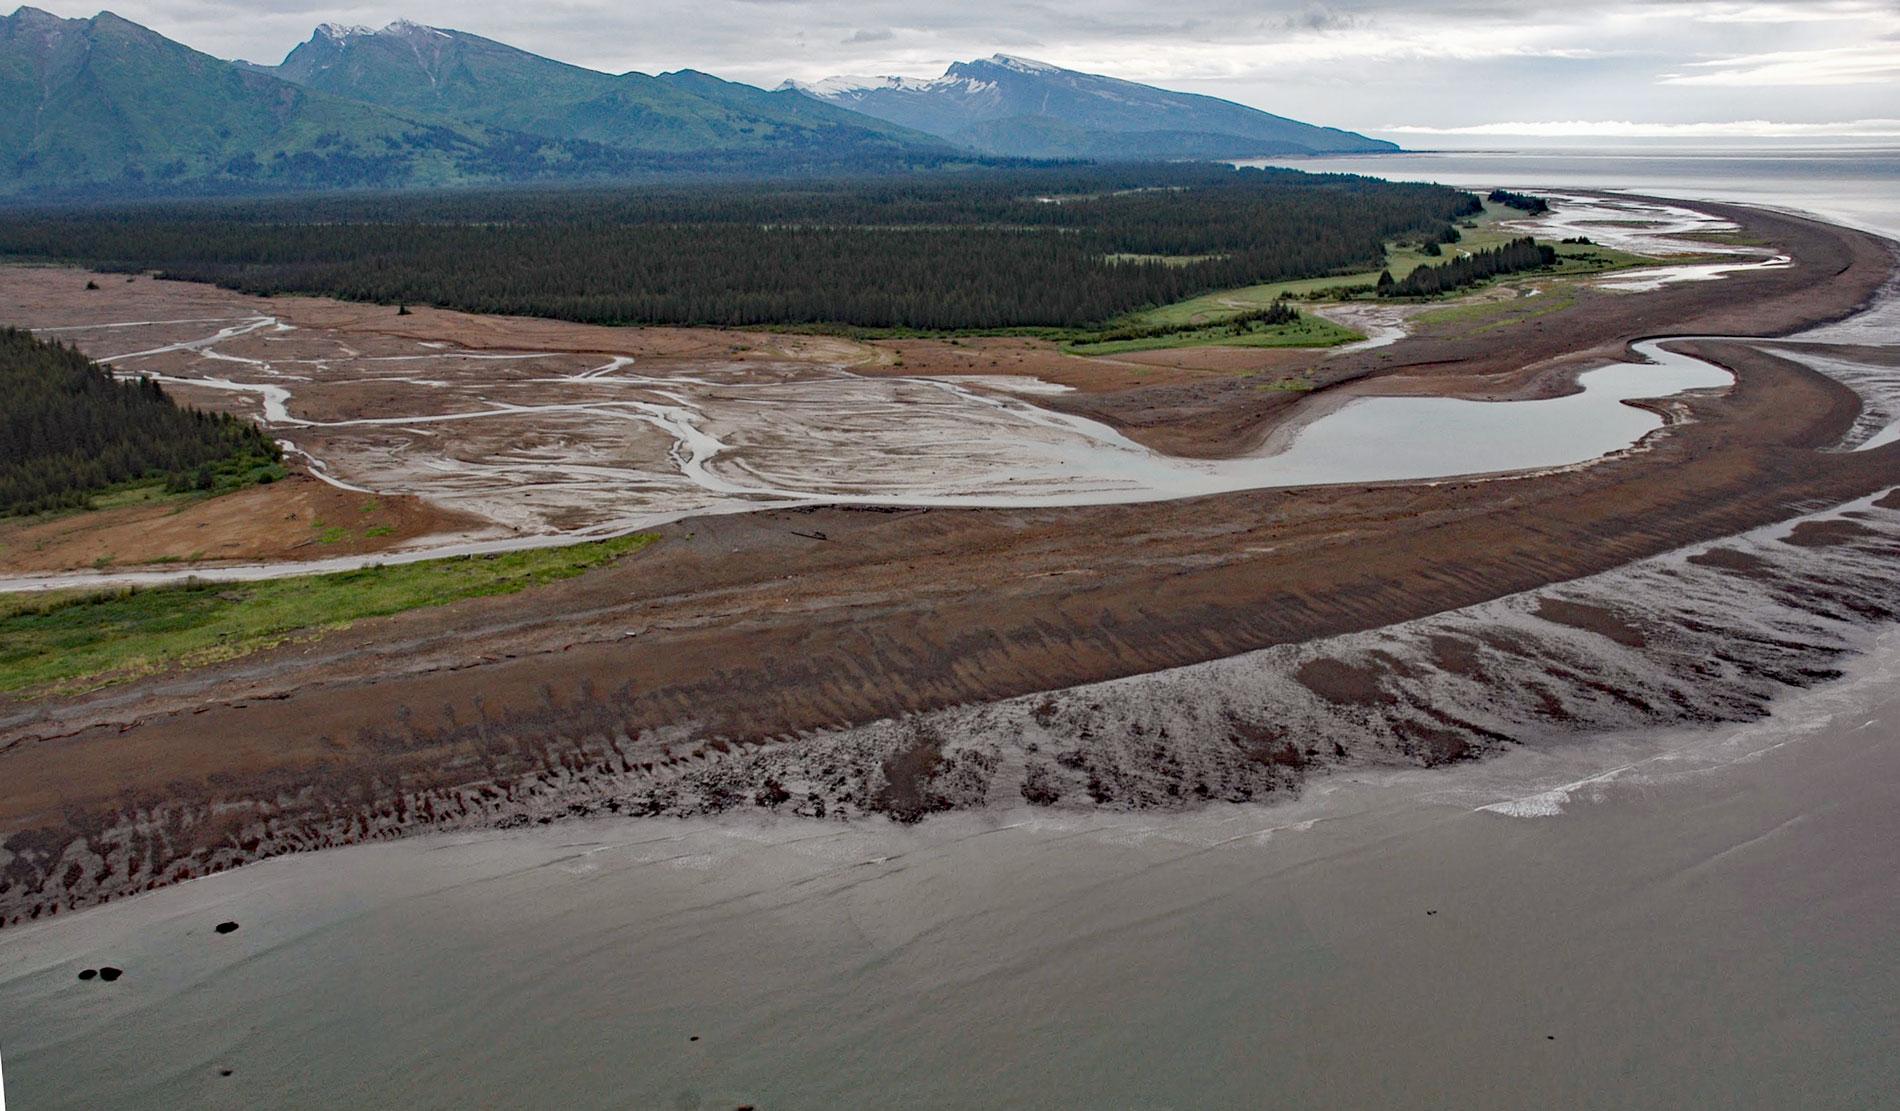
Red River starts from the terminus of Red Glacier on the eastern flank of Mount Iliamna and flows southeast for 7 miles (11.3 km) through Lake Clark National Park and Preserve to the western shore of Cook Inlet, about 126 miles (203 km) southwest of Anchorage and 48 miles (77 km) northwest of Homer, Alaska. The name was first reported in 1912 by the U.S. Coast and Geodetic Survey and is for the red volcanic rocks that cover the glacier at lower elevations and form the beach sediments.
Mount Iliamna is a glaciated stratovolcano with an elevation of 10,0013 feet (3053 m), one of seven volcanoes in this region that have erupted multiple times during the past 10,000 years. Lahar deposits are evident along the Cook Inlet coastline near the mouth of the Red River. A lahar is a violent type of mudflow or debris flow composed of a slurry of pyroclastic material, rocky debris, and water. These deposits along the Red River contain cobbles and boulders of andesite, volcanic rocks that were probably still hot when the lahar flowed to the sea. Spruce trees growing on the lahar deposit are about 300 years old and indicate that the lahar and an associated eruption of Iliamna Volcano occurred at about this time. The lahar flow must have swept down Red Glacier and inundated the Red River Valley, possibly reaching the coast in as little as 30 minutes, and forming an extensive delta at the shoreline.
The Red River transports large quantities of sediment to the coast where they are discharged directly into the ocean. If the rate of sediment supply exceeds the rate of sediment removal by waves and tidal currents, a buildup of sediment occurs and a delta may form. In Cook Inlet, wave erosion and strong currents disperse the sediment away from the river mouth. The strong flood and ebb tidal currents rearrange the river-supplied sediment into long, linear submarine ridges and islands that tend to fan out from the river mouth. Read more here and here. Explore more of the Red River here:

