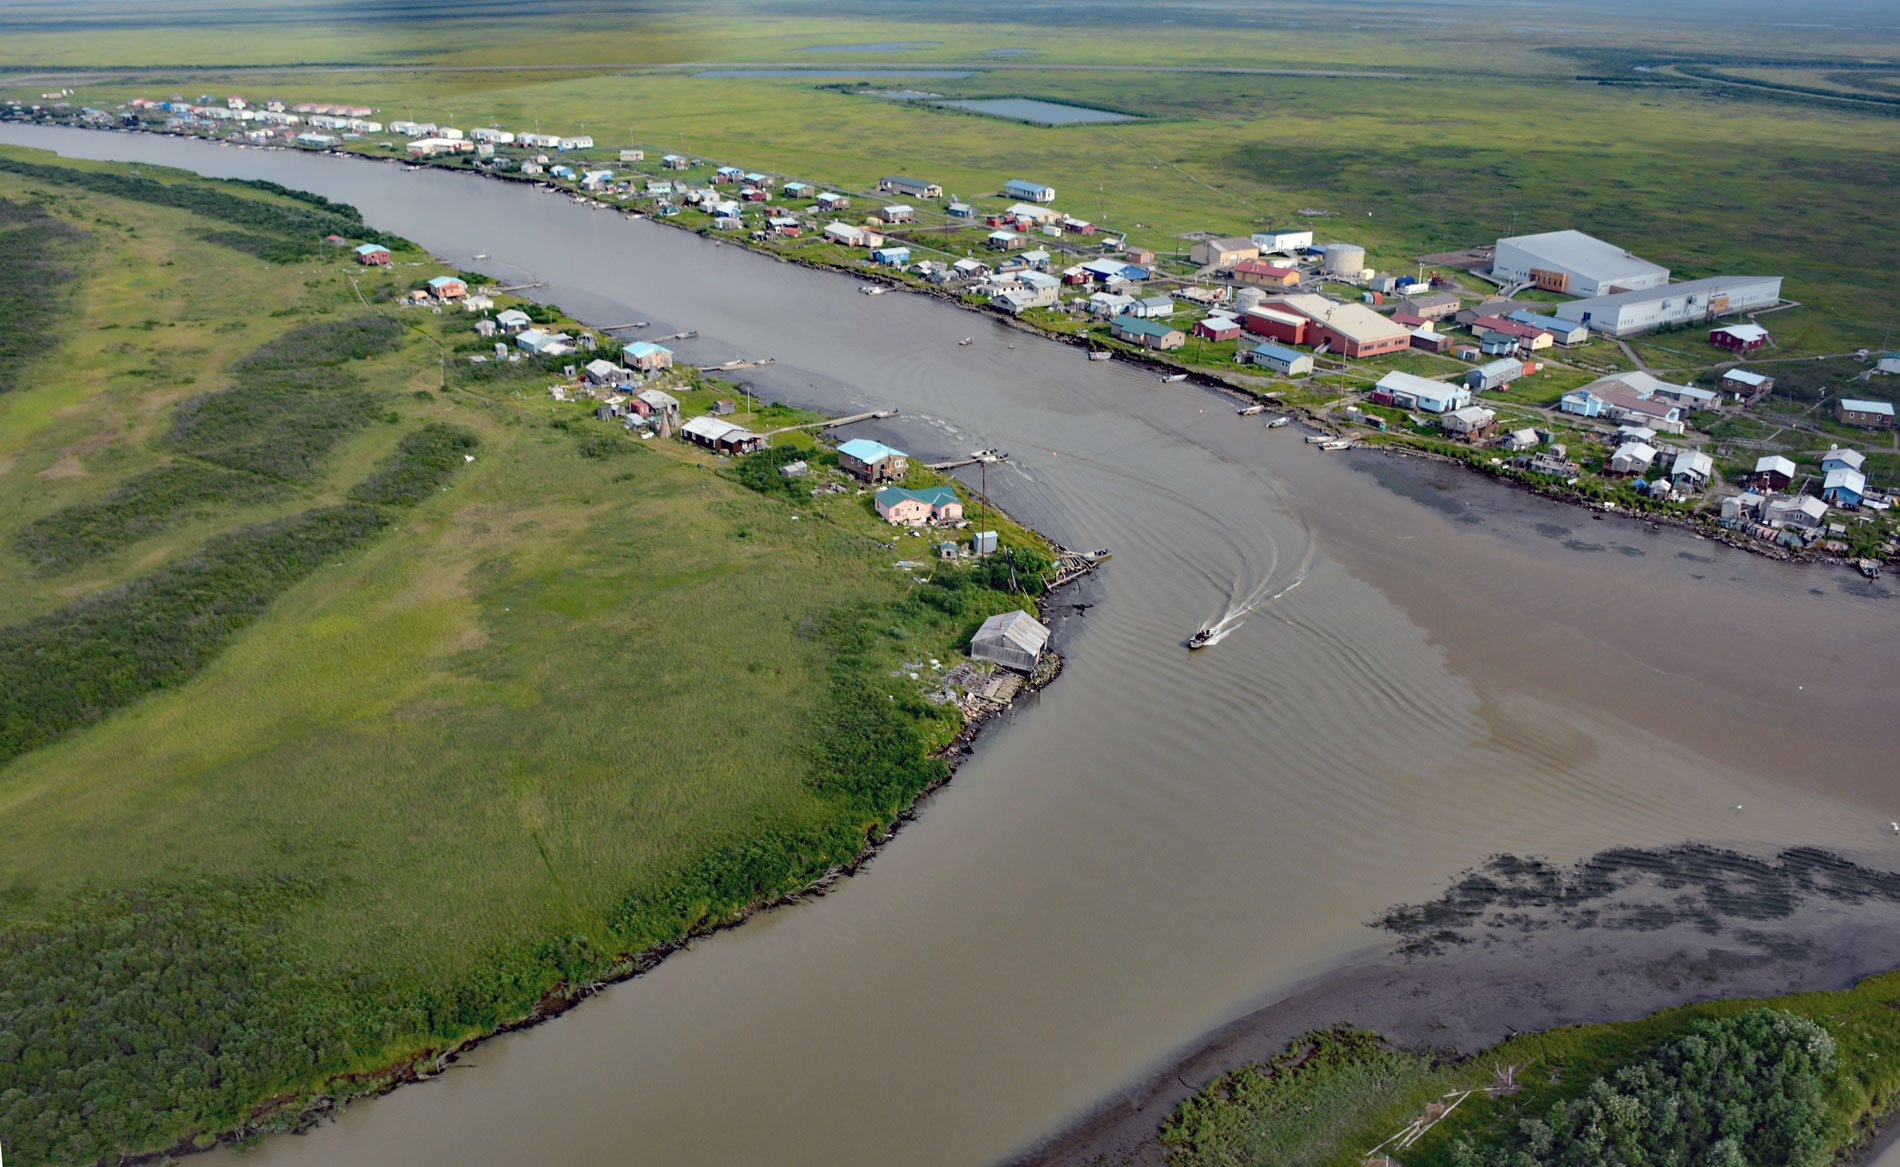
Kotlik is a Yup’ik community situated on Kotlik Slough, a side channel of Apoon Pass formed by the confluence of the Kotlik and Little Kotlik River in the Yukon River Delta, 6 miles (10 km) inland from Pastol Bay on the southern coast of Norton Sound, about 116 miles (187 km) southeast of Nome and 56 miles (90 km) southwest of Saint Michael, Alaska. Apoon Pass is the main distributary flowing through the northern margin of the Yukon River Delta and is the principal navigational channel connecting villages along the lower Yukon River to Norton Sound. The name ‘Apoon’ is from the Yup’ik language meaning ‘thumb’ and reputedly refers to the location of the channel when comparing the delta to a human hand. Apoon Pass at Kotlik is tidal with a diurnal range of about 4 feet (1.2 m); however, wind velocity and direction in the Bering Sea and Norton Sound can severely influence the actual water height, and the community is prone to floods during intense autumn storms when tides are high.
A Russian Orthodox church was built at Kotlik shortly after Redoubt St. Michael was founded in 1833 by traders of the Russian-American Company. A few Russians intermarried with Native women and their offspring became traders with fluency in Russian and Yup’ik. Following the Alaska Purchase in 1867, a fox or mink fur farm was established at Kotlik. The Russian-American Company trading post at the neighboring village of Hamilton was taken over by the Northern Commercial Company, which later became the Alaska Commercial Company. The trading post bought furs and salmon from local hunters and fishermen and allowed credit for store goods. Commerce generated by the Klondike Gold Rush improved the lifestyle of the Yup’ik people and contributed to the development of communities in the north delta region including the village of Bill Moores Slough, Pastolik, and Chaniliut located at the mouth of Apoon Pass on Pastol Bay where a Catholic church was established, and the Bureau of Indian Affairs built a one-room school. An intense fall flood at Chaniliut during the early 1950s damaged the trading post and some homes which resulted in the school being moved 5 miles (8 km) upstream to Kotlik and coercing the residents of the Chaniliut, Bill Moores Slough, Pastolik, and Hamilton to move to Kotlik during the late 1950s and early 1960s. Due to its location with easy access from Norton Sound by large riverboats and barges, Kotlik became one of the larger commercial centers of the northern Yukon River delta, despite having no road infrastructure.
Erosion at Kotlik occurs along approximately 3,000 feet (915 m) of riverbank centered in the vicinity of the confluence of the Kotlik River, Little Kotlik River and Apoon Pass. Riverbank erosion is affecting 42 residential buildings, the Alaska Commercial Company store, and other buildings along the waterfront. From 1951 to 2015, erosion rates varied between 1 and 2.3 feet (0.3-0.7 m) per year which has widened the slough and undermined existing infrastructure such as powerlines, waterlines, and boardwalks. Erosion at Kotlik is caused by permafrost thaw, flooding, general riverine processes, and boat wakes. Engineering studies have found that flooding associated with ice breakup does not appear to significantly contribute to erosion due to the riverbanks still being frozen, and therefore, resistant to erosion by either river ice or water. River currents during both flood and ebb tides also appear to have little effect on erosion of riverbanks. Boat wakes are presently about three times more important in causing erosion than wind waves. In 1986, a concrete revetment was constructed along the community waterfront but began to fail within three years because of improper grade preparation. In 2017, the U.S. Army Corps of Engineers reported that erosion protection at Kotlik has been installed in several locations multiple times but did not effectively mitigate erosion. Read more here and here. Explore more of Kotlik and Apoon Pass here:

