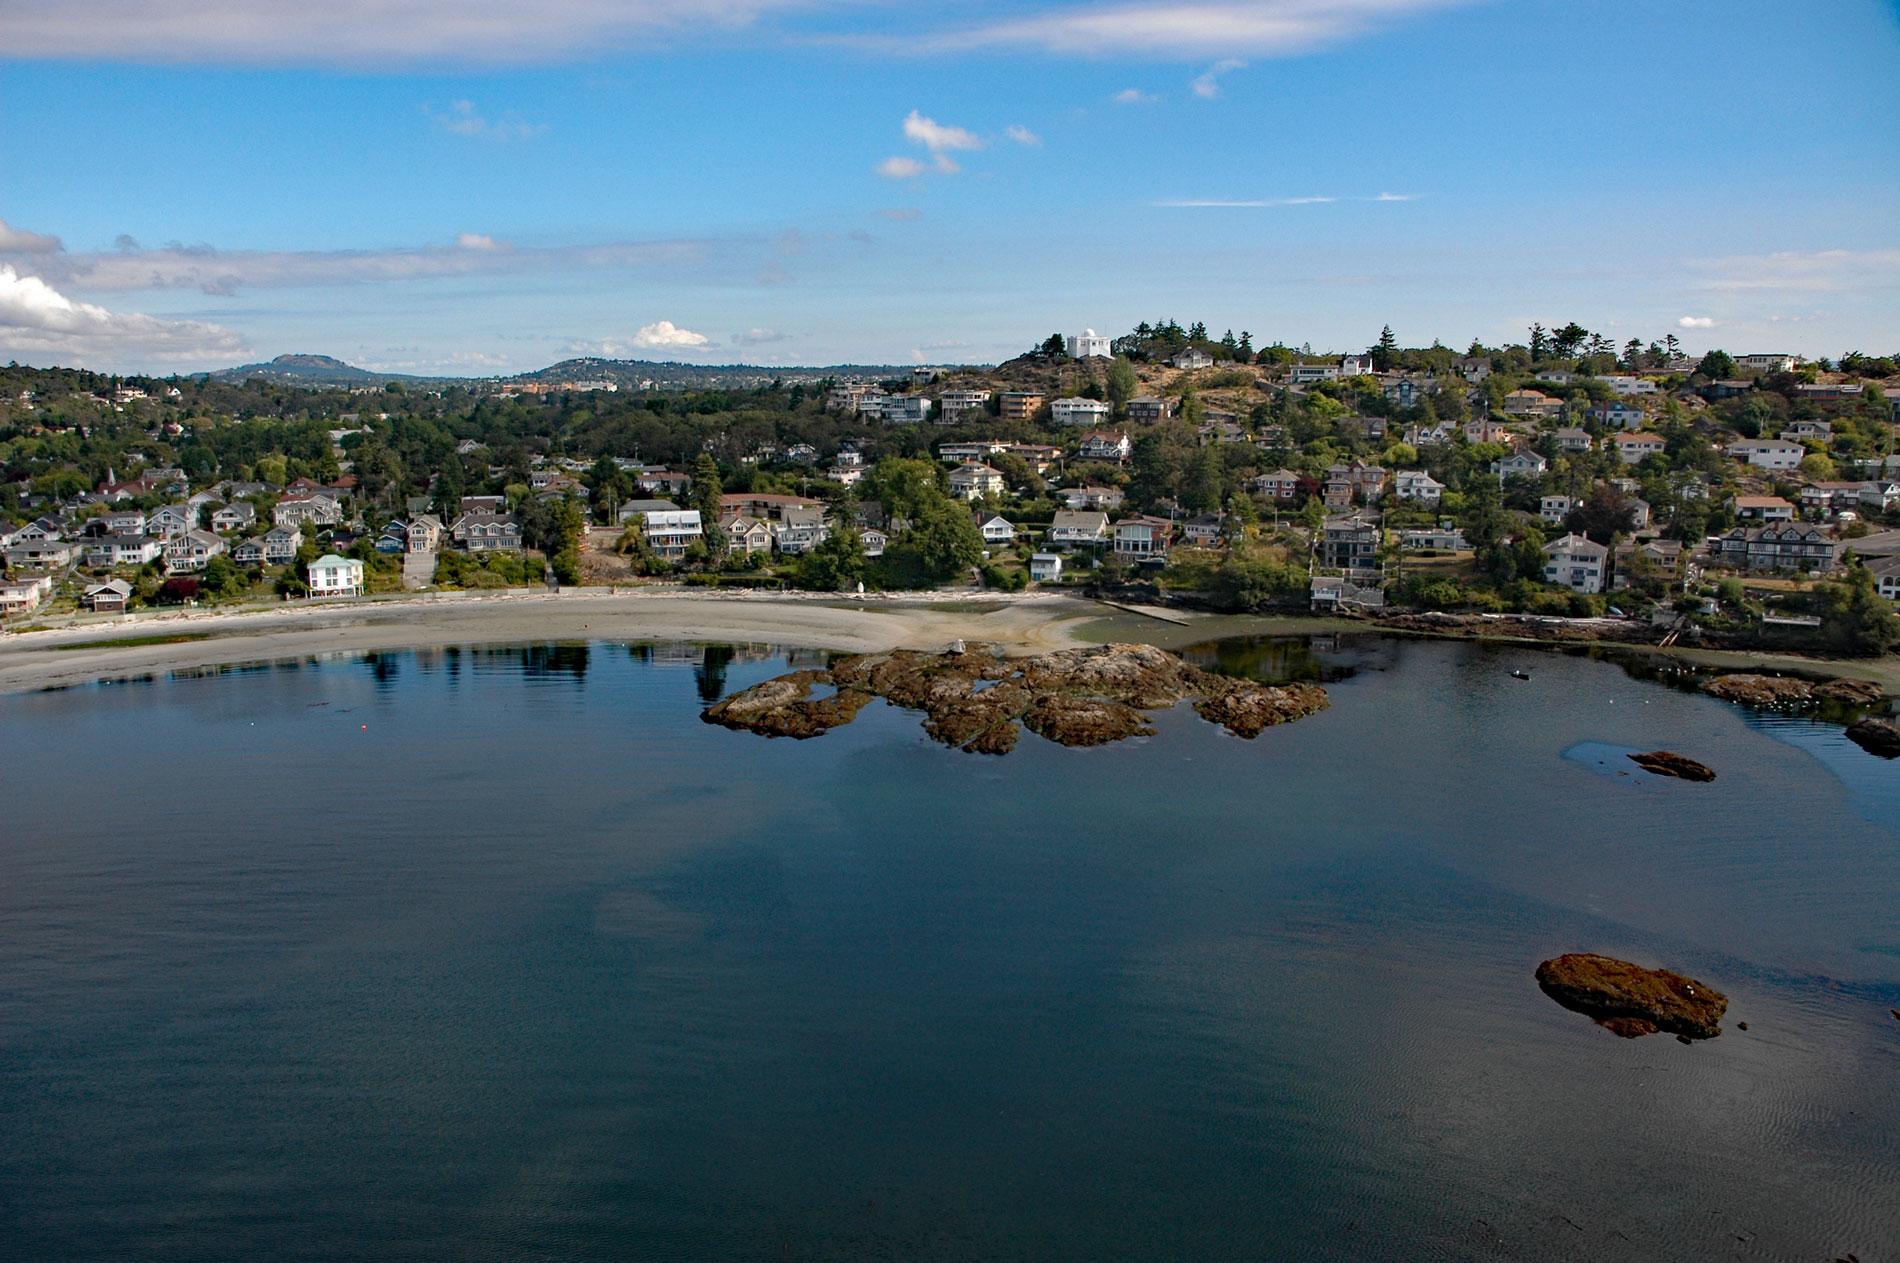
Gonzales Bay is on Vancouver Island and the northern shore of the Strait of Juan de Fuca, situated between Ross Bay to the west and McNeill Bay to the east, and is also the name of a neighborhood about 1.4 miles (2.3 km) southwest of Oak Bay and 2 miles (3.2 km) southeast of downtown Victoria, British Columbia. The name is for Spanish explorer Gonzalo Lopez de Haro, the ship’s pilot on Princesa Real commanded by Manuel Quimper, who charted the waters around Vancouver Island in 1790. The bay was originally named Foul Bay for the numerous rocks and reefs, but when Joseph Despard Pemberton, the first colonial land surveyor, built his home and named it Gonzales, the developing neighborhood became known by the same name and eventually also the bay.
The sheltered waters and pleasant beach of Gonzales Bay became a popular location for swimmers and picnickers and by the beginning of the 20th century, several summer homes were built along the shoreline. In 1903, the Chinese Consolidated Benevolent Association purchased land at Harling Point for a cemetery on the east side of Gonzales Bay. Through the 1950s and 1960s, Gonzales beach remained a popular recreation area, but the small beach cottages were gradually replaced by larger more permanent houses. In 1969, a severe storm caused significant shoreline erosion and a retaining wall was built around most of the bay the following summer.
In 1914, an observatory and the Pacific Coast headquarters for the Dominion Meteorological Services was built on top of Gonzales Hill to the designs of William Henderson and meteorologist Francis Napier Denison. The building became known as the Gonzales Observatory and for 75 years recorded weather, seismic and astronomical readings. In 1989, Environment Canada abandoned the building and in 1992 the 4.3 acres (1.75 ha) of land was purchased by the Capital Region District for a park. Read more here and here. Explore more of Gonzales Bay here:

