
Climate Change
Recent Articles
More Articles
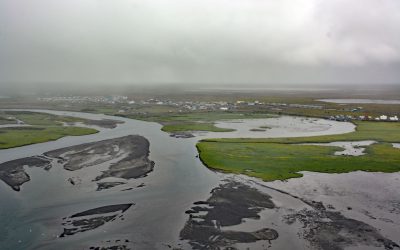
Quinhagak, Kanektok River
Quinhagak or Kwinhagak is a Central Yup’ik community situated on the Yukon-Kuskokwim Delta near the mouth of the Kanektok River, about 73 miles (118 km) south of Bethel and 45 miles (72 km) north of Goodnews Bay, Alaska.
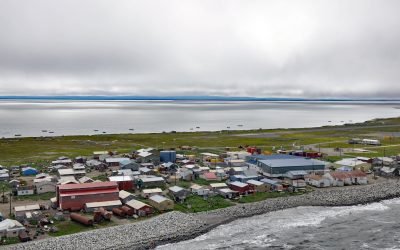
Shishmaref, Sarichef Island
Shishmaref is an Iñupiat community situated on Sarichef Island, a barrier island between Shishmaref Inlet to the south and the Chukchi Sea to the north, on the northern coast of the Seward Peninsula in the Bering Land Bridge National Preserve, about 105 miles (169 km) southwest of Kotzebue and 73 miles (117 km) northeast of Wales, Alaska.
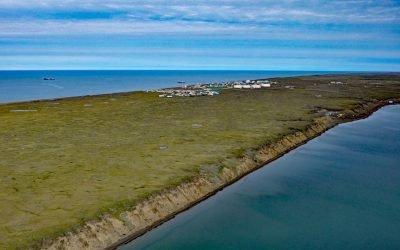
Wainwright, Kuk River
Wainwright is an Iñupiat community on the Chukchi Sea coastline situated on a barrier beach adjacent to Wainwright Inlet and the Kuk River, about 94 miles (151 km) northeast of Point Lay and 86 miles (138 km) southwest of Utqiaġvik, Alaska.
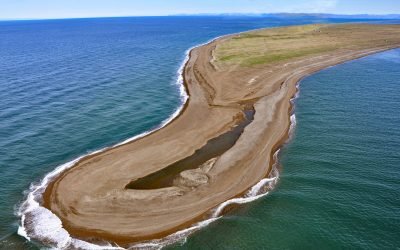
Tigara Peninsula, Chukchi Sea
Tigara Peninsula is a prominent point of land extending west for 13 miles (21 km) from the mouth of the Kukpuk River on the Cape Lisburne peninsula into the Chukchi Sea, about 320 miles (516 km) southwest of Utqiaġvik and 151 miles (244 km) northwest of Kotzebue, Alaska.
About the background graphic
This ‘warming stripe’ graphic is a visual representation of the change in global temperature from 1850 (top) to 2019 (bottom). Each stripe represents the average global temperature for one year. The average temperature from 1971-2000 is set as the boundary between blue and red. The colour scale goes from -0.7°C to +0.7°C. The data are from the UK Met Office HadCRUT4.6 dataset.
Click here for more information about the #warmingstripes.