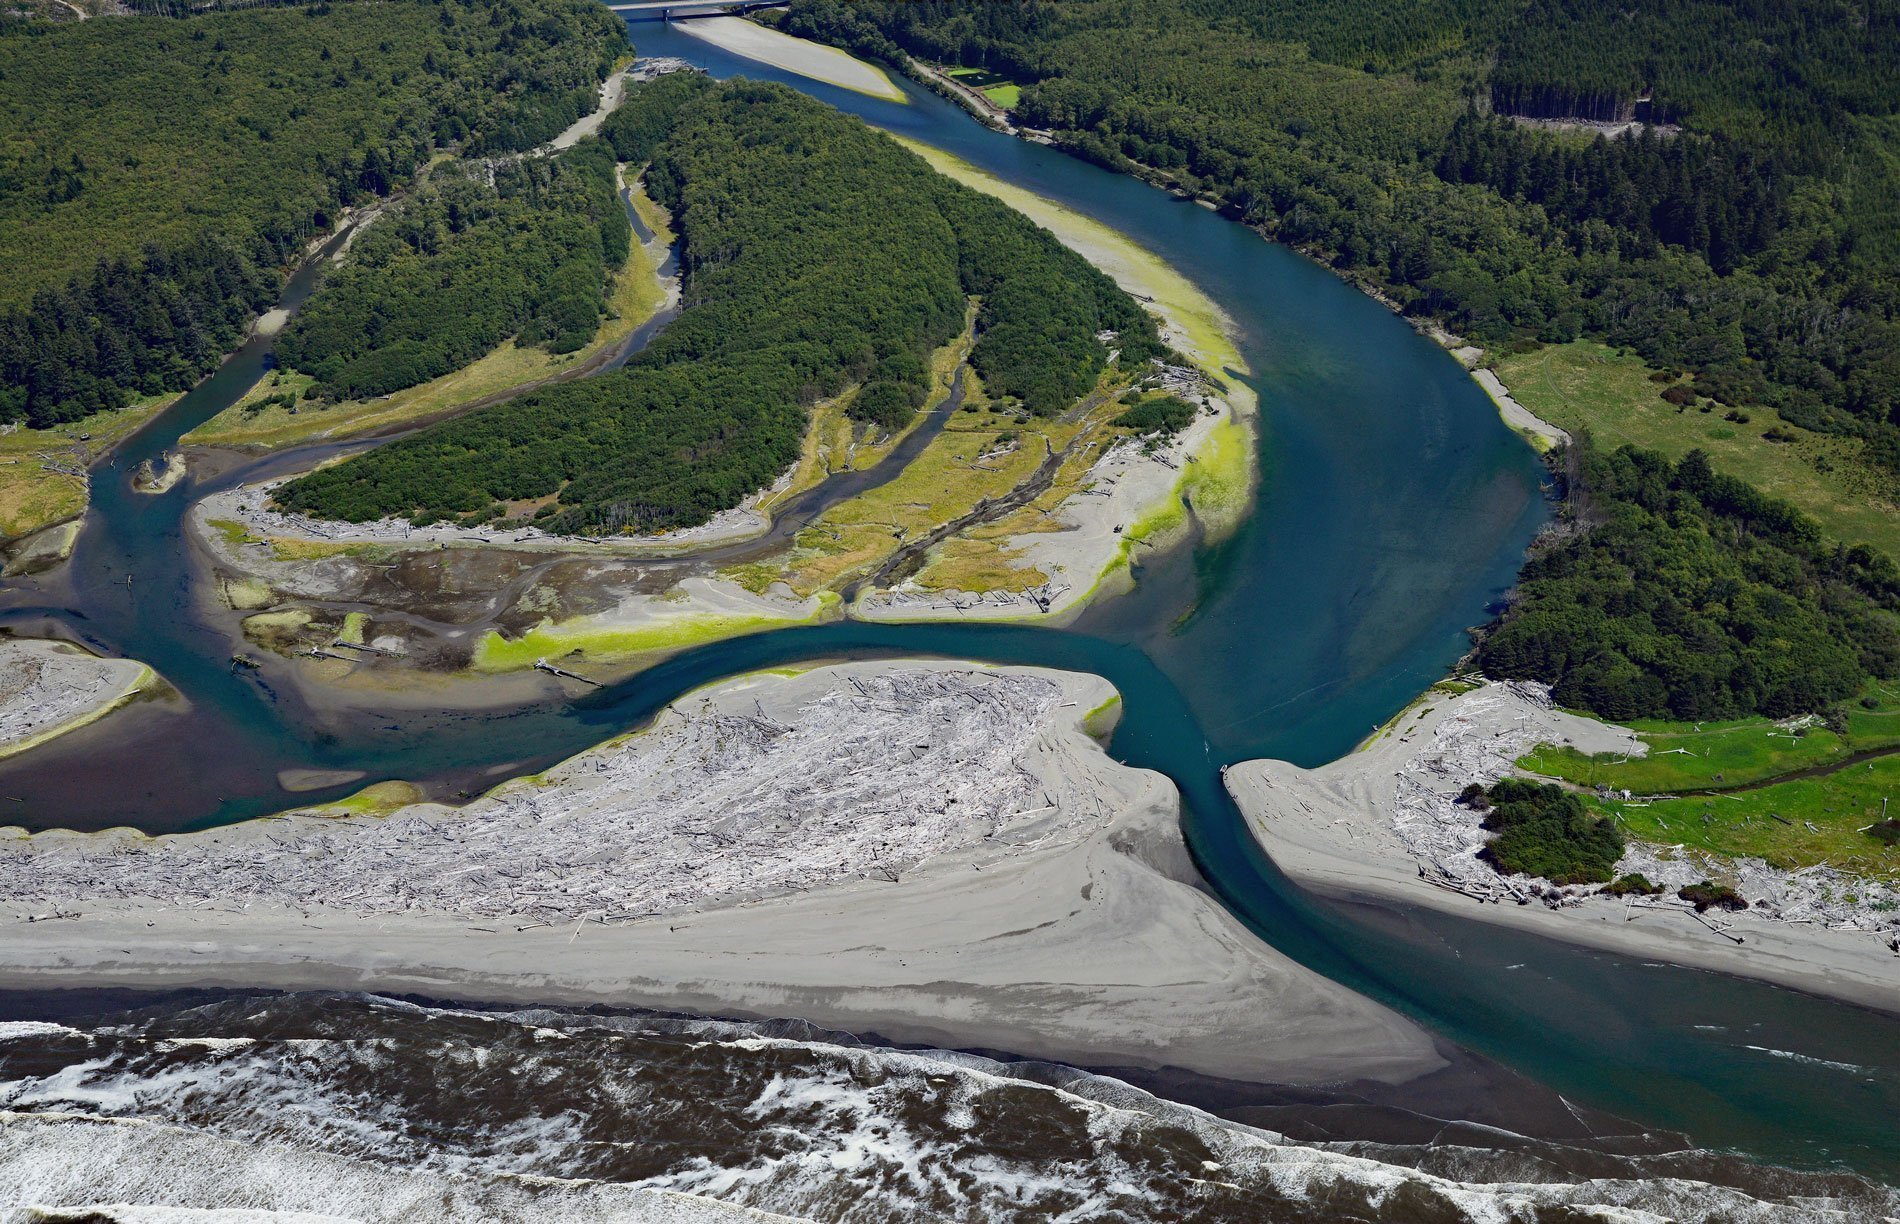
Queets River originates from a group of cirque basins at an elevation of about 5,000 feet (1500 m) on the south flank of the Olympic Mountains, with tributaries emanating from the Humes Glacier to the north and the Queets Glacier to the south, and drains a watershed of 130,559 acres (52,836 ha) while flowing about 53 miles (85 km) to the Pacific Ocean, about 60 miles (96 km) southwest of Aberdeen and 5 miles (8 km) south of Kalaloch, Washington. Most of the river flows through Olympic National Park, except for the last 4 miles (6.4 km) that are within the Quinault Reservation. The village of Queets is situated about 1 mile (1.6 km) upstream from the ocean. According to the oral tradition of the Quinault Nation, which includes the Queets people, the river’s name comes from the legend of Kwate, the changer, or the Great Spirit and Transformer, who came to the mouth of the Queets River. After fording the cold river he rubbed his legs to restore circulation and small rolls of dirt formed under his hand. He threw them into the water and from them, a man and a woman came forth, who became the ancestors of the Queets people. Kwate told them they would remain on the river and would be known as K’witzqu, because of the dirt from which their skin was made. The word ‘Queets’ was derived from the name of the Quai’tso tribe and first appeared on the Surveyor General‘s map of the Washington Territory.
The Queets River is unusual in being a relatively large river flowing through a low-gradient heavily forested valley where no logging is permitted. The forests on the western side of the Olympic Mountains are in the national park and have one of the highest rates of biomass production per unit area in North America. River discharge rates in the winter can be very high, resulting in frequent log jams and new channels. The river is not kept clear of woody debris, making it one of the few North American rivers of its size in which large log jams are common. The natural state of the river provides ideal fish habitat and has been a source of food for Indigenous Peoples for thousands of years. Coast Salish villages were historically dependent on annual runs of Pacific salmon and steelhead. Chinook ran from March to December, with the largest runs in early autumn. Coho runs began in early autumn and continued past the first of the year, followed by steelhead runs peaking in mid-winter and lasting until spring. Steelhead were invaluable during the months when most other foods were scarcest and supplied nearly half of coastal villages’ total annual salmonid food. Each watershed was owned and managed by a single patrilocal village. Each household owned an independent stretch of river that was often marked with wood or stone family crests. Proprietary river fishing gave downstream grounds some advantage and were usually reserved for high-ranking households.
Salmon, steelhead, and other fisheries in Washington State are now managed cooperatively in a unique government-to-government relationship. Native American nations such as the Quinault were granted fishing rights by treaties signed with the federal government in the 1850s. In those treaties, tribal nations agreed to allow the peaceful settlement of much of western Washington by European American pioneers, and provided the land to do so, in exchange for their continued right to fish, gather shellfish, hunt and exercise other sovereign rights. A 1974 federal court case decided by U.S. District Court Judge George Boldt, reaffirmed the tribes’ treaty rights to harvest salmon, steelhead, and other fish species and established them as co-managers of Washington fisheries. Today, the Washington Department of Fish and Wildlife and the various tribes work together to conserve and sustainably manage fish populations to provide opportunities for recreational, commercial, ceremonial, and subsistence fisheries. Read more here and here. Explore more of the Queets River and Olympic National Park here:

