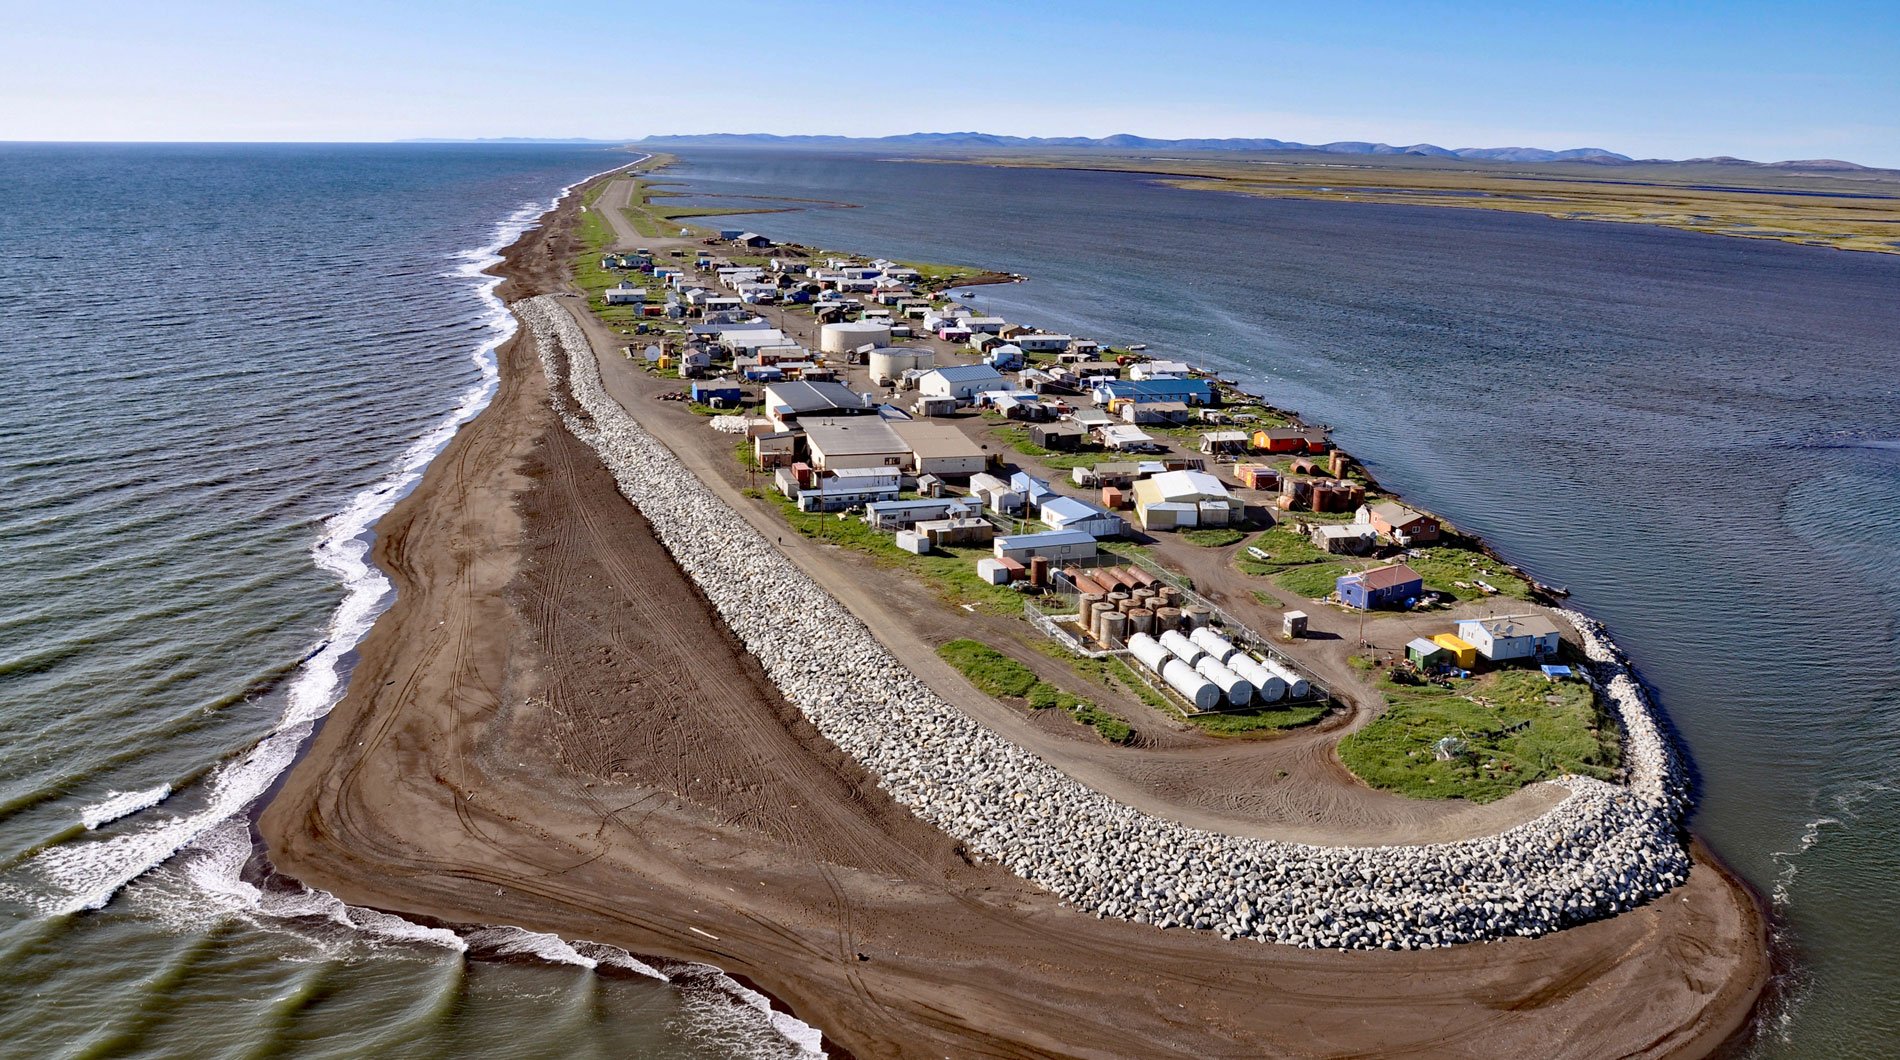
Kivalina is a community located on a barrier island between the Chukchi Sea and Kivalina Lagoon, about 79 miles (127 km) northwest of Kotzebue and 72 miles (116 km) southeast of Point Hope, Alaska. In 1847, the Iñupiat village was located at the north end of the lagoon with the name “Kivualinagmut” when it was first reported by Lieutenant L.A. Zagoskin of the Russian Imperial Navy. Kivalina Lagoon is about 10 miles (16 km) long and is fed by the Kivalina River and the Wulik River. Singauk Entrance is a water passage connecting Kivalina Lagoon with the Chukchi Sea.
Kivalina has long been a stopping place for travelers along the Chukchi coast. In 2009, artifacts were found representing the Ipiutak culture, a pre-Thule non-whaling civilization that disappeared over 1,000 years ago. Kivalina is one of 10 Alaska communities that hunt the bowhead whale including Kaktovik, Nuiqsut, Utqiaġvik, Wainwright, Point Hope, Little Diomede and Wales, and Savoonga and Gambell on Saint Lawrence island. In about 1900, after commercial whalers had decimated the bowhead population, reindeer were brought to the area from Siberia and some people were trained as reindeer herders. In 1960, an airstrip was built and in the 1970s, a new school and an electric system were built in the village.
Temperatures in the Arctic are rising at more than twice the rate of the global average resulting in more violent ocean storms, flooding, and erosion beneath the homes of Kivalina. Sea ice that once protected the island from winter storms no longer forms early enough in the fall to prevent rising waters and storm surge from reaching the island’s shores. Patchy sea ice also makes winter travel and hunting difficult and dangerous. In 2000, the decision was made to move the village but finding a safer location has been challenging. In the meantime, several beach protection projects have slowed the erosion so that the community may have another decade to relocate. Read more here and here. Explore more of Kivalina here:

