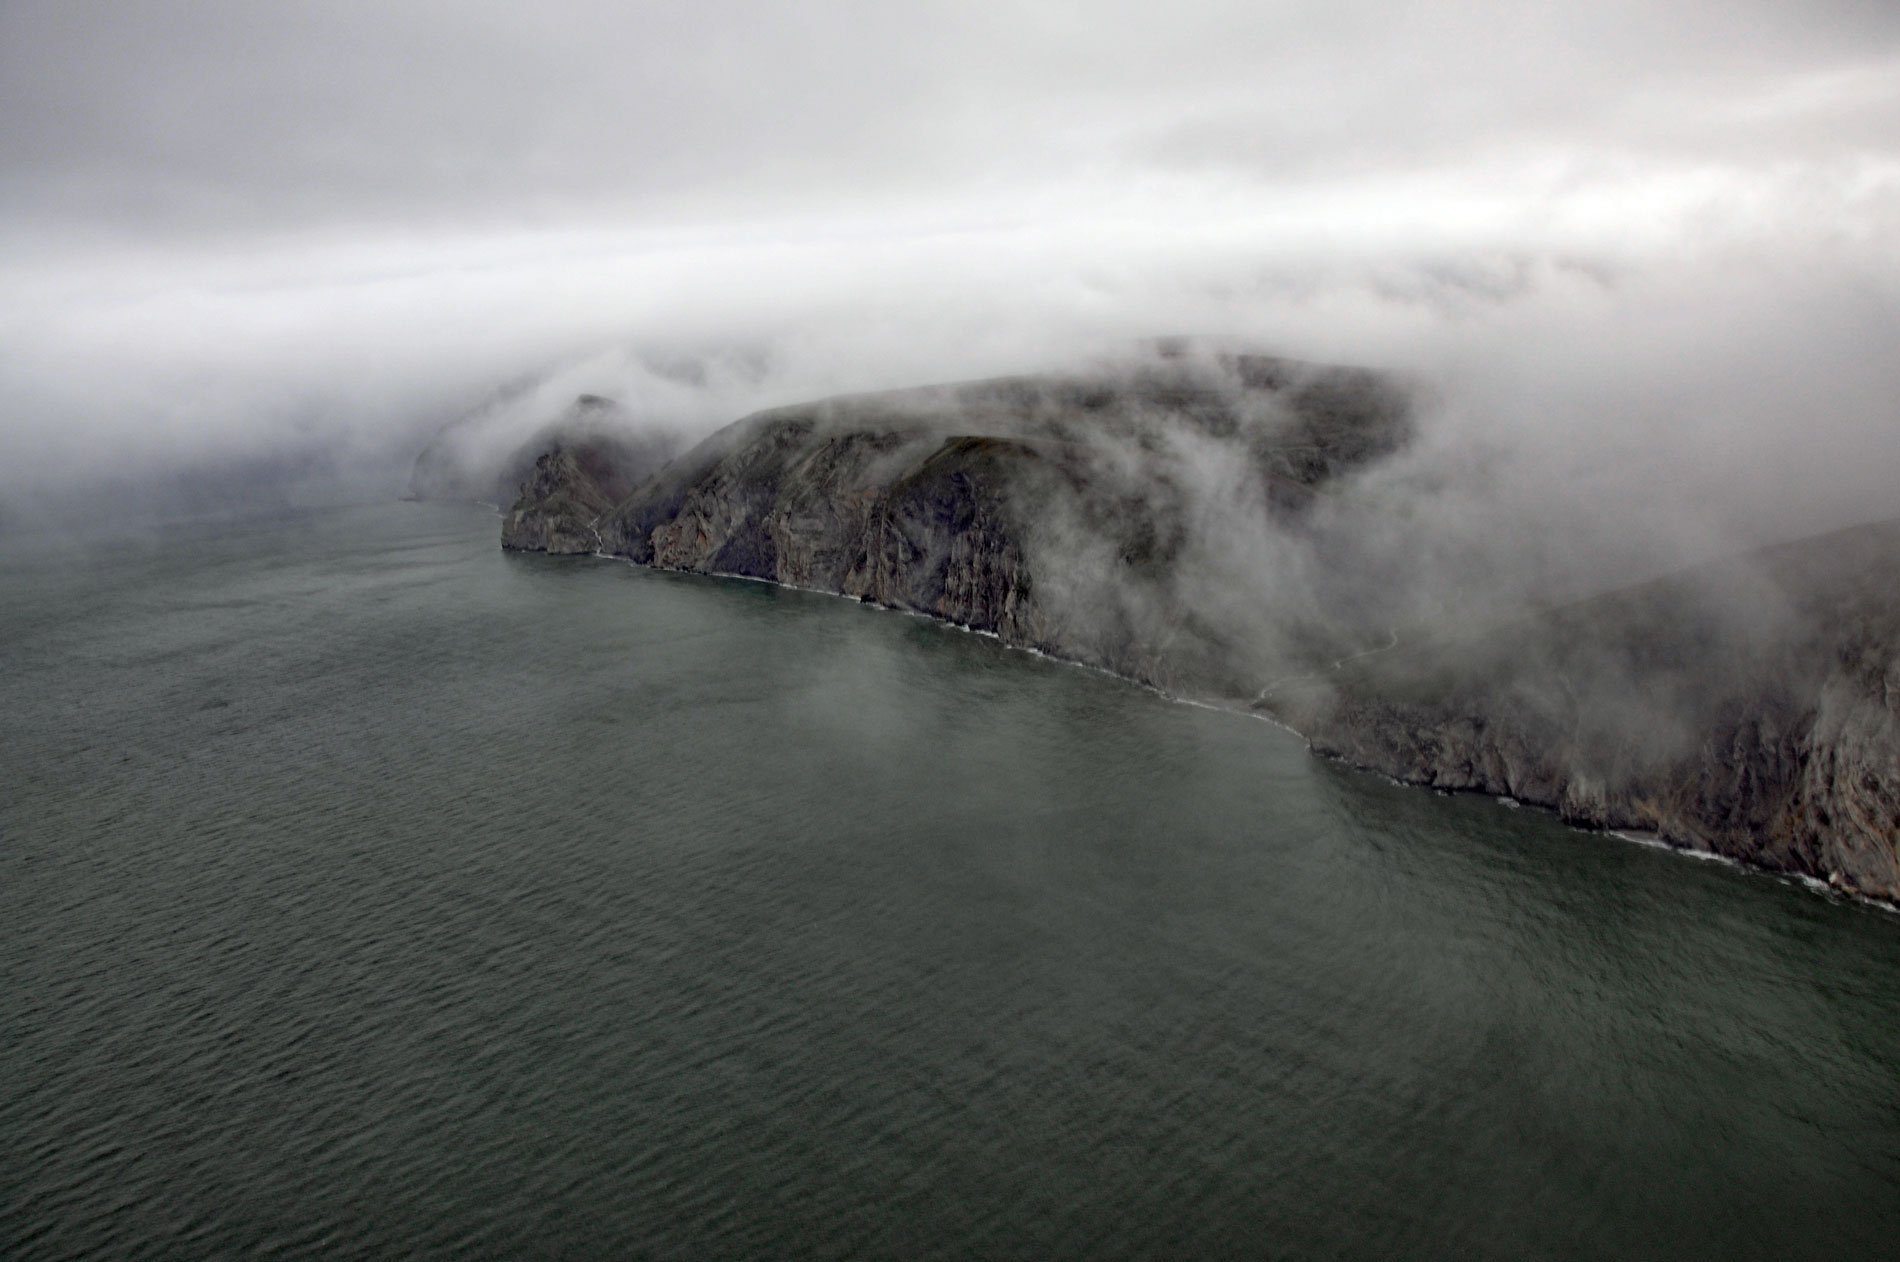
Alokut Point is a steep promontory with a summit elevation of 1015 feet (310 m) that represents an abrupt change in direction of the Cape Lisburne coastline and forms the northwest terminus of the Lisburne Hills, about 100 miles (160 km) southwest of Point Lay and 39 miles (63 km) north-northeast of Point Hope, Alaska. The point is well known by mariners for being one of the stormiest places along the coast due to the flow acceleration of winds around the headland. Alokut is an Iñupiaq language name reputedly meaning ‘the jaw’ and was applied to the point by the U.S Coast and Geodetic Survey in 1950. Cape Lisburne was named in 1778 by Captain James Cook, probably after Wilmot Vaughan, 4th Viscount Lisburne and Earl of Lisburne. The Iñupiaq name for the cape is ‘Uivvaq’, which means ‘distant cape’, and is often spelled ‘Wevok’ on maps and charts. The cape represents rocks of the Lisburne Group that developed during the early Carboniferous period and consists mostly of limestone and chert. These rocks were a valuable asset for early humans and provided an abundant source of high-quality stone for tool manufacture.
Cape Lisburne borders the bowhead whale spring migratory route and these whales are known to follow the coastal contour to take advantage of sea ice shear zones which are generally associated with the shoreline. The promontory at Alokut Point provided early humans with an excellent overview of the whale migration corridor. East of Point Alokut the shoreline changes from steep bedrock to depositional sediments that provided settlement sites. Archaeological excavations suggest that at least three distinct and successive cultures, the Ipiutak, Birnirk, and Punuk peoples occupied the Uivvaq site between 950 and 1600 AD. Two hundred years ago, Uivvaq was the second most important winter settlement after Tikigaq at Point Hope, and was the only other place to conduct a spring bowhead whale hunt. The primary appeal of the Uivvaq site was for the variety of food sources available including caribou, mountain sheep, and birds. Like most coastal locales, walrus were typically available during the early summer and fall, while beluga whales appeared in the spring and summer, and small seals were hunted throughout the year. During the 19th century, the population of the Tikigagmiut nation underwent a nearly catastrophic decline, due to the consequences of internecine warfare, the collapse of food resources, and the appearance of outsiders bearing infectious disease, alcohol, and firearms. By 1870, the Uivvaq whale hunt had ceased and the site was inhabited by only one or two families until 1950.
In 1950, the U.S. Air Force constructed a radar station at Cape Lisburne as part of the Aircraft Control and Warning network intended to provide early warning of approaching Soviet aircraft. The radar was situated on the cape summit and was connected by an aerial tramway to support facilities constructed near the beach. During construction of the airstrip, several abandoned sod houses were destroyed representing roughly half of the former village of Uivvaq. In 1955, Cape Lisburne became part of the Distant Early Warning Line, the most westernmost station on the line which stretched east across the northern part of Alaska, Canada and into Greenland. Cape Lisburne controlled five manned stations at Point Lay, Wainwright, Cape Sabine, Icy Cape and Peard Bay. In 1985, the facility was upgraded and re-designated as Cape Lisburne Long-Range Radar Site operated and maintained by contractors. The site was connected to the Elmendorf Regional Operations Control Center by satellite communications, and today, is generally unattened. Major storms in 2011 and 2012 caused severe shoreline erosion which impacted the use of the runway, and the U.S. Army Corps of Engineers constructed a seawall designed to withstand storms with a 50-year return interval. Read more here and here. Explore more of Alokut Point and Cape Lisburne here:

