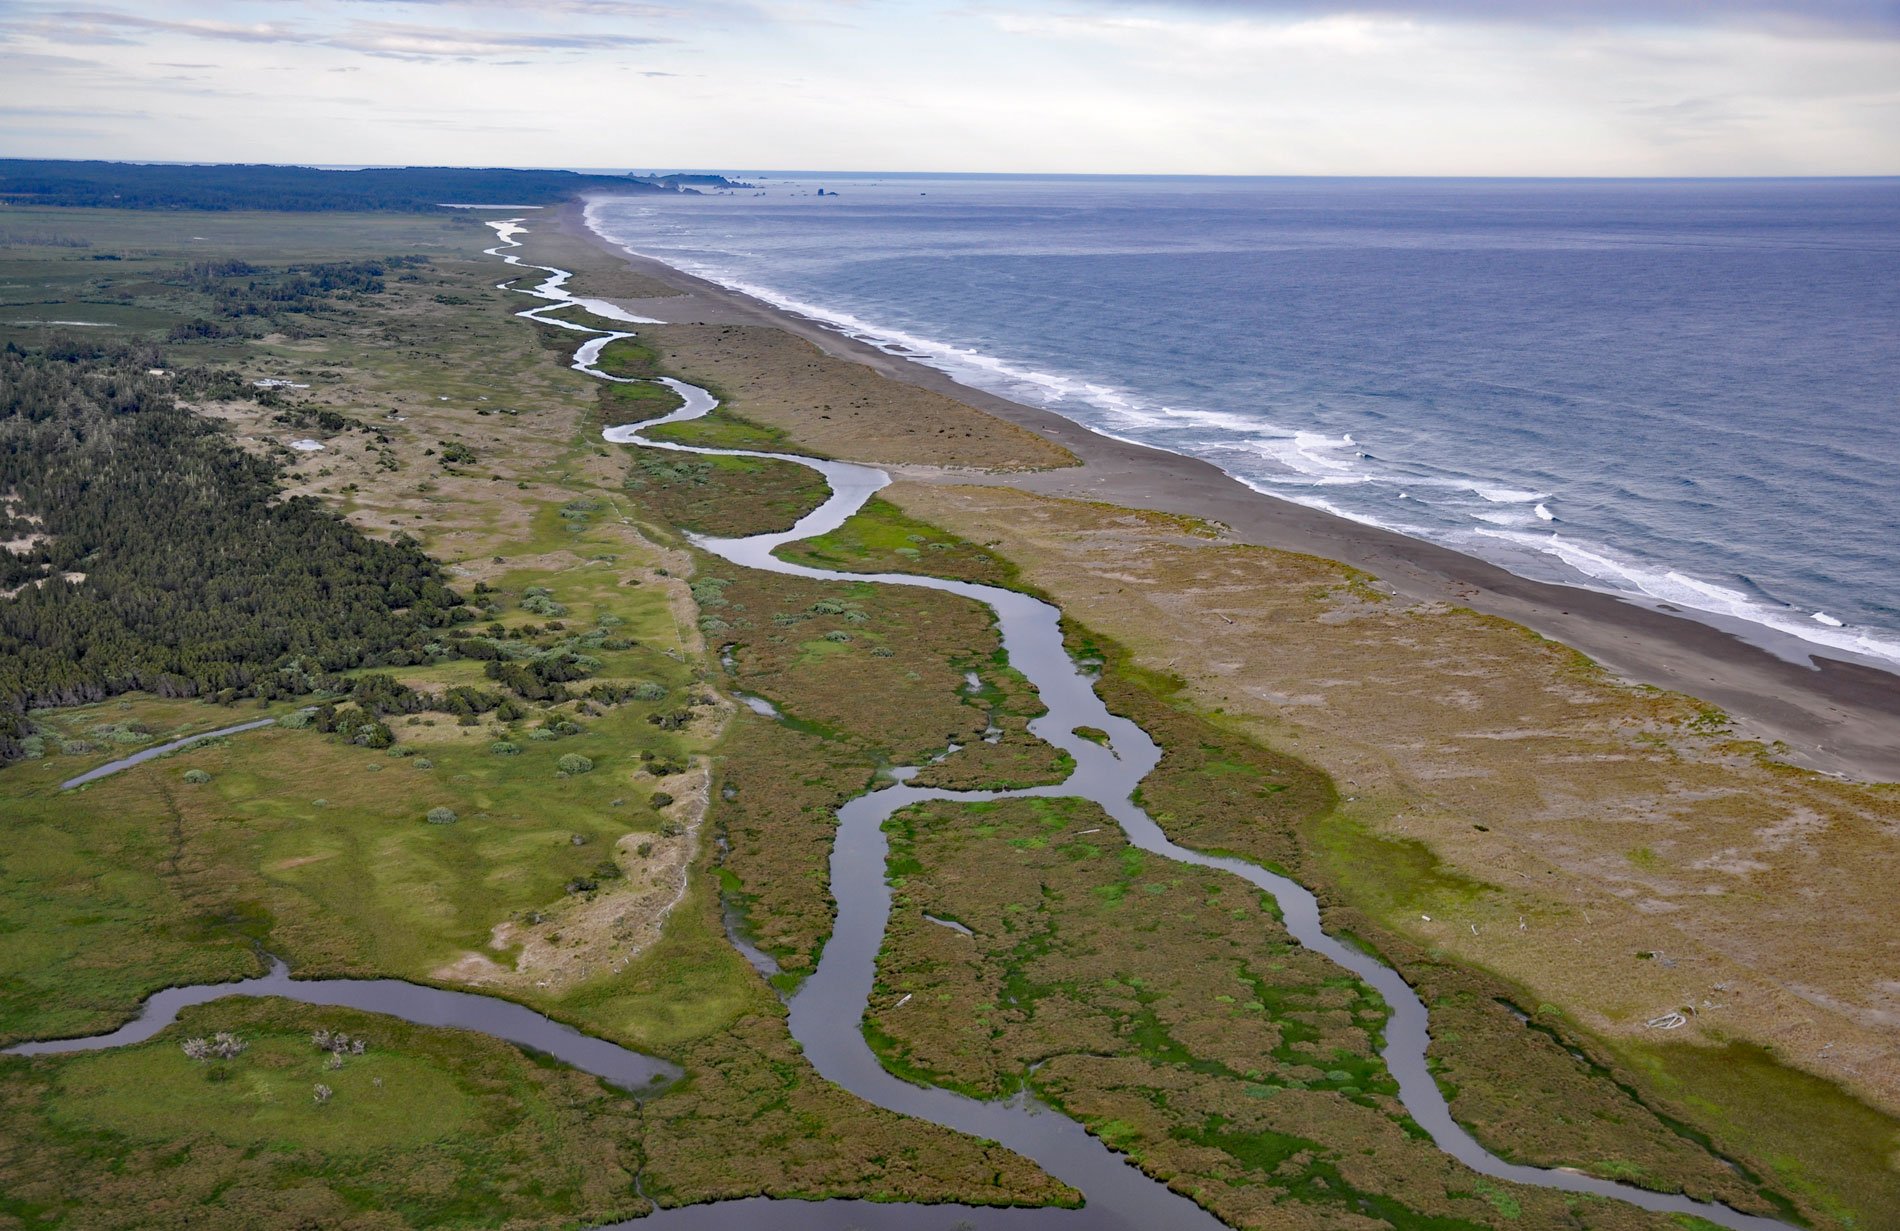
Floras Creek starts from an elevation of roughly 2,786 feet (849 m) on the north flank of Edson Butte in the Oregon Coast Range and flows generally west for 13 miles (21 km), draining a watershed of 51,652 acres (20,903 ha) to the outlet of Floras Lake where the stream makes a sharp turn to the north and becomes the New River, about 12 miles (19 km) north of Port Orford and 3 miles (5 km) west-southwest of Langlois, Oregon. The creek was reputedly named for Fred Flora, a 19th-century settler and miner who lived nearby. New River began to form after a major flood in 1890 and became trapped behind a foredune stabilized by introduced European beach grass so that the stream runs parallel to the beach. Several other local streams such as Langlois, Morton, Butte, Bethel, Davis, Fourmile, and Twomile creeks that once flowed directly into the ocean now feed the trapped stream and further develop this ‘New River’. The upper Floras Creek watershed is formed mostly by rocks of the Dothan Formation that developed during the Early Cretaceous and Late Jurassic. The lower elevations represent unconsolidated alluvial sediments that developed during the Pleistocene.
The Floras Creek watershed is the traditional territory of the Coquille people, who are related to the tribes of South Slough and Coos Bay to the north and the Sixes River to the south. Due to intertribal marriages, many members are also related to Umpqua, Coos, Siuslaw, Tututni, Shasta Costa, Chetco, and Tolowa tribes. The Coquille tribal area was defined in the 1940s as bounded along the Oregon Coast from approximately Floras Creek in the south to a point of rocks by Whiskey Run Creek in the north, and inland to the crest of the Coast Range. The Coquille people lived seasonally in the tidewaters and estuaries, constructing lean-tos made of cedar planks or more permanent homes on willow-frame poles covered with sod or grass. They hunted elk and deer, and gathered berries and tuberous roots. Special significance was given to salmon, and much ceremony and ritual surrounded the annual return of the fish that were caught using weirs and basket traps. The arrival of Euro-American settlers in the 19th century and the resulting conflicts over resource use, resulted in the Treaty of 1855, which forced the Coquille people to move to the Coast Indian Reservation. Today, the Coquille people are represented by two federally recognized tribes: the Coquille Indian Tribe or the Confederated Tribes of the Siletz.
The Floras Creek watershed has been intensively managed for 150 years and is more than 90 percent privately owned. Most of the upland watershed has been logged, with some areas in a second or third rotation. At the height of the timber harvest era, there were 18 active sawmills in the Langlois area. The lowlands historically were a series of spruce and swamp woodlands, with multiple braided channels, and large conifers along the banks of wetlands, seeps, and tributaries. These swamps were cleared for agriculture, and many of the wetlands in the watershed have been drained, ditched and channelized to keep standing water off pasture lands. Dairy farming was extensive in the early 1900s, and Langlois was once known as ‘Dairyville’ because of the abundance of dairy cows and milk and cheese products. In 1915, cranberries were introduced as a domestic crop and have continued to be part of the local economy, now owning more than half of the water rights in the watershed. Steelhead and cutthroat trout are well distributed throughout the watershed, but salmon use in the middle and upper portions of the watershed is limited by a natural barrier. Coho habitat is identified in the Lower Floras, Willow Creek, and Floras Lake, and Chinook use the lower mainstem of the Floras and portions of Willow Creek. Water quality in Floras Creek and its tributaries, both based on water temperatures and chemistry, is currently rated the lowest of all Oregon south coast streams. Read more here and here. Explore more of Floras Creek and New River here:

