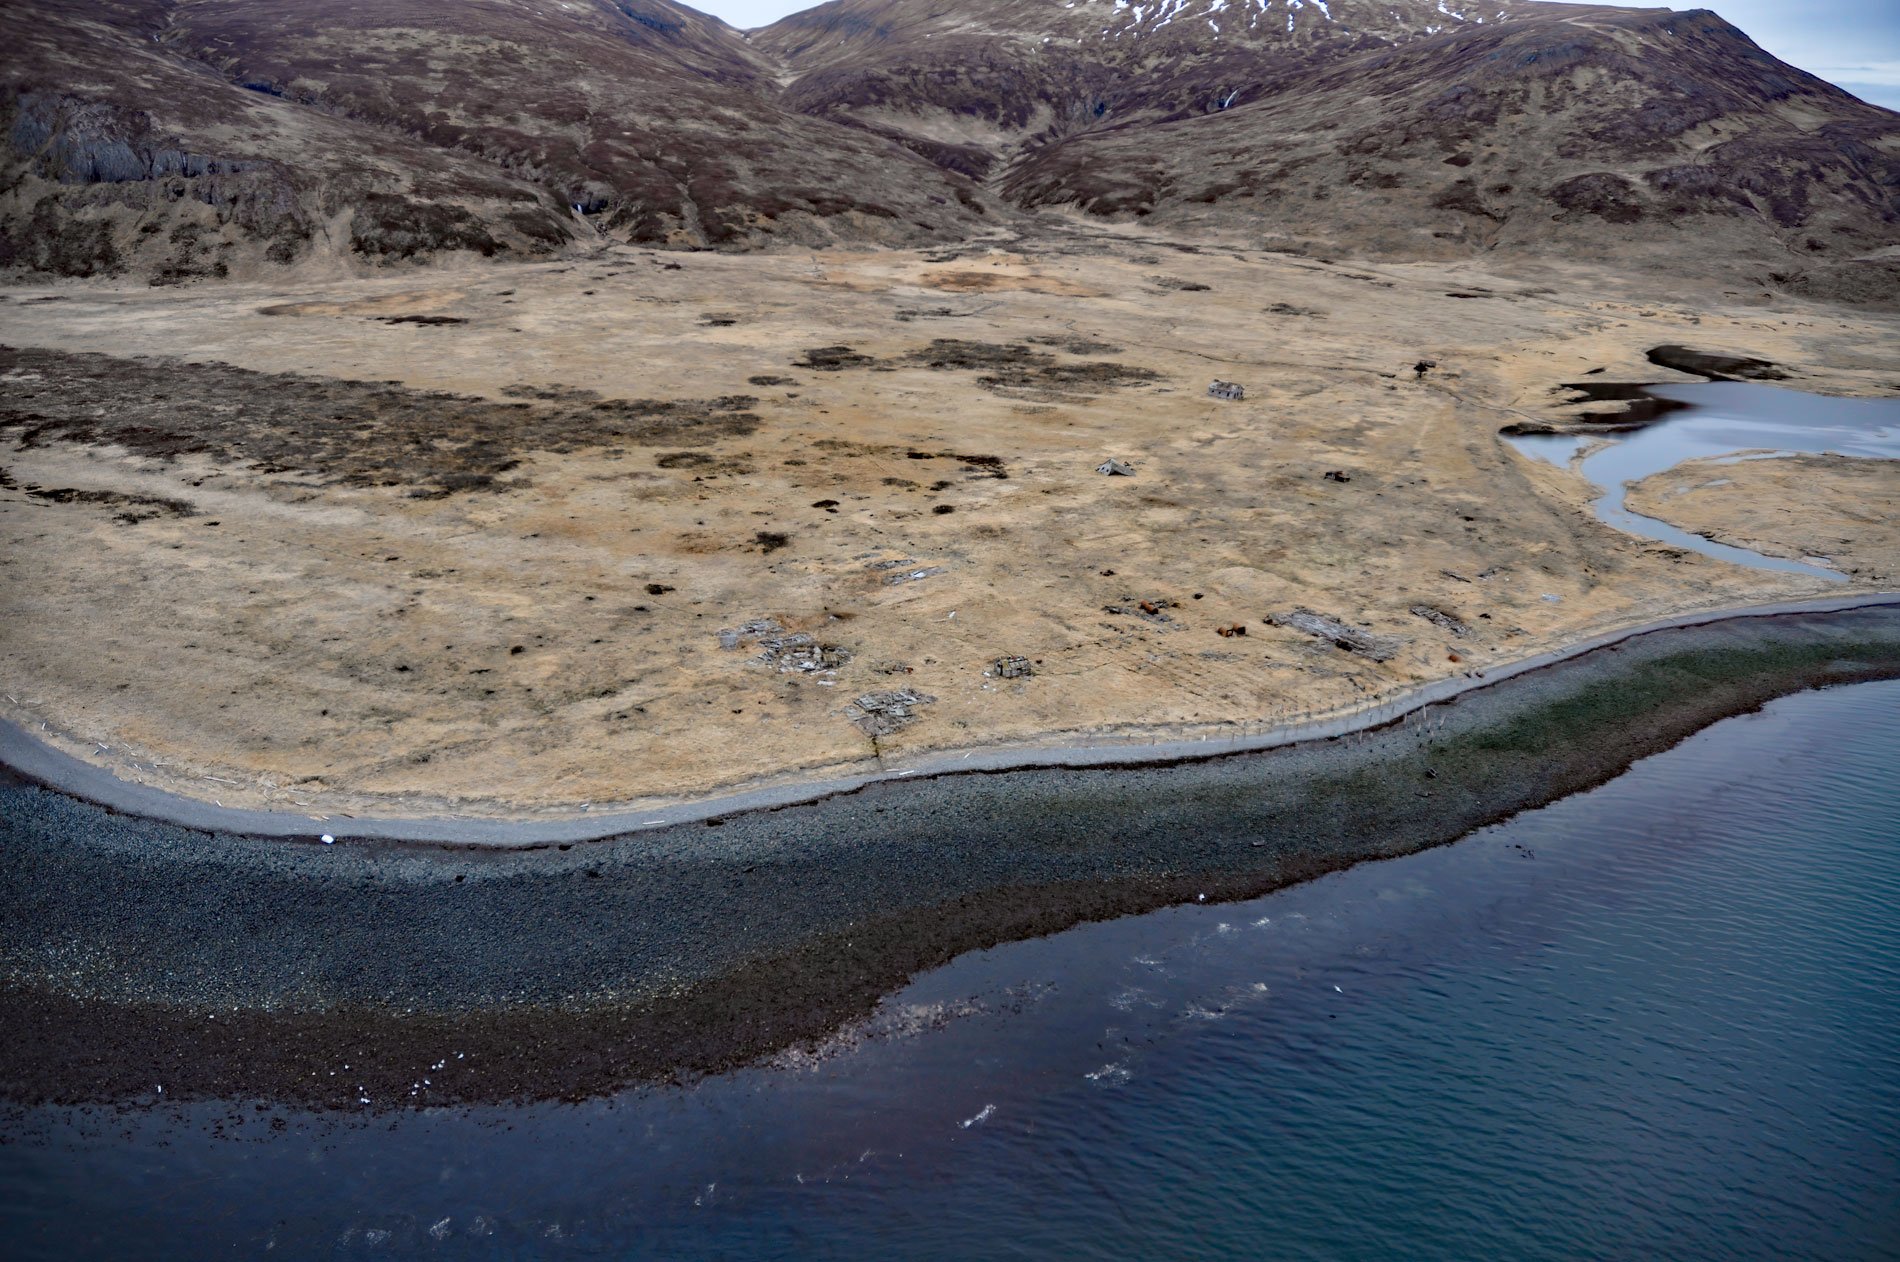
Ikatan Peninsula is connected to the northeastern tip of Unimak Island by a sand spit or tombolo separating Ikatan Bay to the north from Otter Cove to the south and is the site of the historical community of Ikatan, about 143 miles (230 km) northeast of Unalaska and 8 miles (13 km) south-southeast of False Pass, Alaska. The name is from the Aleut language and was first reported by Father Joann Veniaminov as ‘Ikatok’ in the 1830s when the peninsula was an island. Since then, sand and gravel have been deposited by longshore currents driven by waves and developed a connecting beach. The eastern part of the peninsula consists of volcanic breccia and lava flows, and the western part is formed by the Belkofski Formation which developed during the Miocene or late Oligocene and consists of tuff and volcanic sandstone, siltstone, and conglomerate. Unimak Island is considered to be the easternmost of the Fox Islands in the eastern Aleutian Islands and includes several stratovolcanoes including Mount Shishaldin, Isanotski Peaks, Roundtop Mountain, Mount Westdahl, and Pogromni Volcano.
In 1886, James Madison and associates of San Francisco fitted out the schooner Francis Alice and started a shore station for Pacific cod at Ikatan. The venture operated for one season and was taken over by Thomas W. McCollam, of the McCollam Fishing & Trading Company. Lynde & Hough, another well-known San Francisco firm, early entered the codfish industry and built shore stations at Unga Harbor, Squaw Harbor, in the Shumagin Islands, Sanak Islands, and the Alaska Peninsula. About 1898, the McCollam Fishing & Trading Company and Lynde & Hough formed the Union Fish Company. In the fall of 1905, the Pacific States Trading Company, also of San Francisco, established another shore station at Ikatan. In 1916, the station was sold to the Union Fish Company. The labor force for the shore stations was mostly Scandinavians and Aleut villagers from Sanak, Morzhovoi, and Belkofski. Stations were located so that fishermen to go out daily in dories to the adjacent banks and the catch could be stored ashore until a vessel could be sent north from San Francisco to transport the accumulated cargo. The men would row out to the fishing banks between 3 and 4 am in summer and between 4 and 5 am in winter, hand line the cod, and return between 9 and 12 with varying numbers of fish. The dories held from 180 to 220 fish depending on size, but a greater number could be handled only in calm or fairly calm weather. In the afternoon, the fish were cleaned and salted. After 1915, codfish began to disappear from the region, and by 1930, they were not sufficient in numbers to support the fishery.
The salmon industry began in the Unimak area in 1916 when Pacific American Fisheries opened a cannery at Ikatan targeting the June sockeye salmon run. Salmon canneries initially operated with company-owned salmon traps that needed little labor to maintain. The cannery established 11 fish traps within 19 miles (31 km) of shoreline on the Ikatan Peninsula. Eventually, fishermen were hired by the cannery to fish areas without salmon traps. In 1928, the company moved the cannery from Ikatan to False Pass where it has since operated continuously. The population of Ikatan village depended entirely on the cannery and when it closed, a few people stayed and built homes or occupied buildings left by the cannery. Trapping foxes during the winter supplemented their income. In 1920, the population of Ikatan during the summer salmon season was roughly 125, and in 1940, the village had a population of 38. The last official population data for Ikatan was for 1950 when 29 people were reported living there. The last residents to live in Ikatan were the George Kochuten family and they moved away in the early 1960s, leaving the village abandoned. The old cannery site property is now privately owned. Read more here and here. Explore more of Ikatan Peninsula and Unimak Island here:

