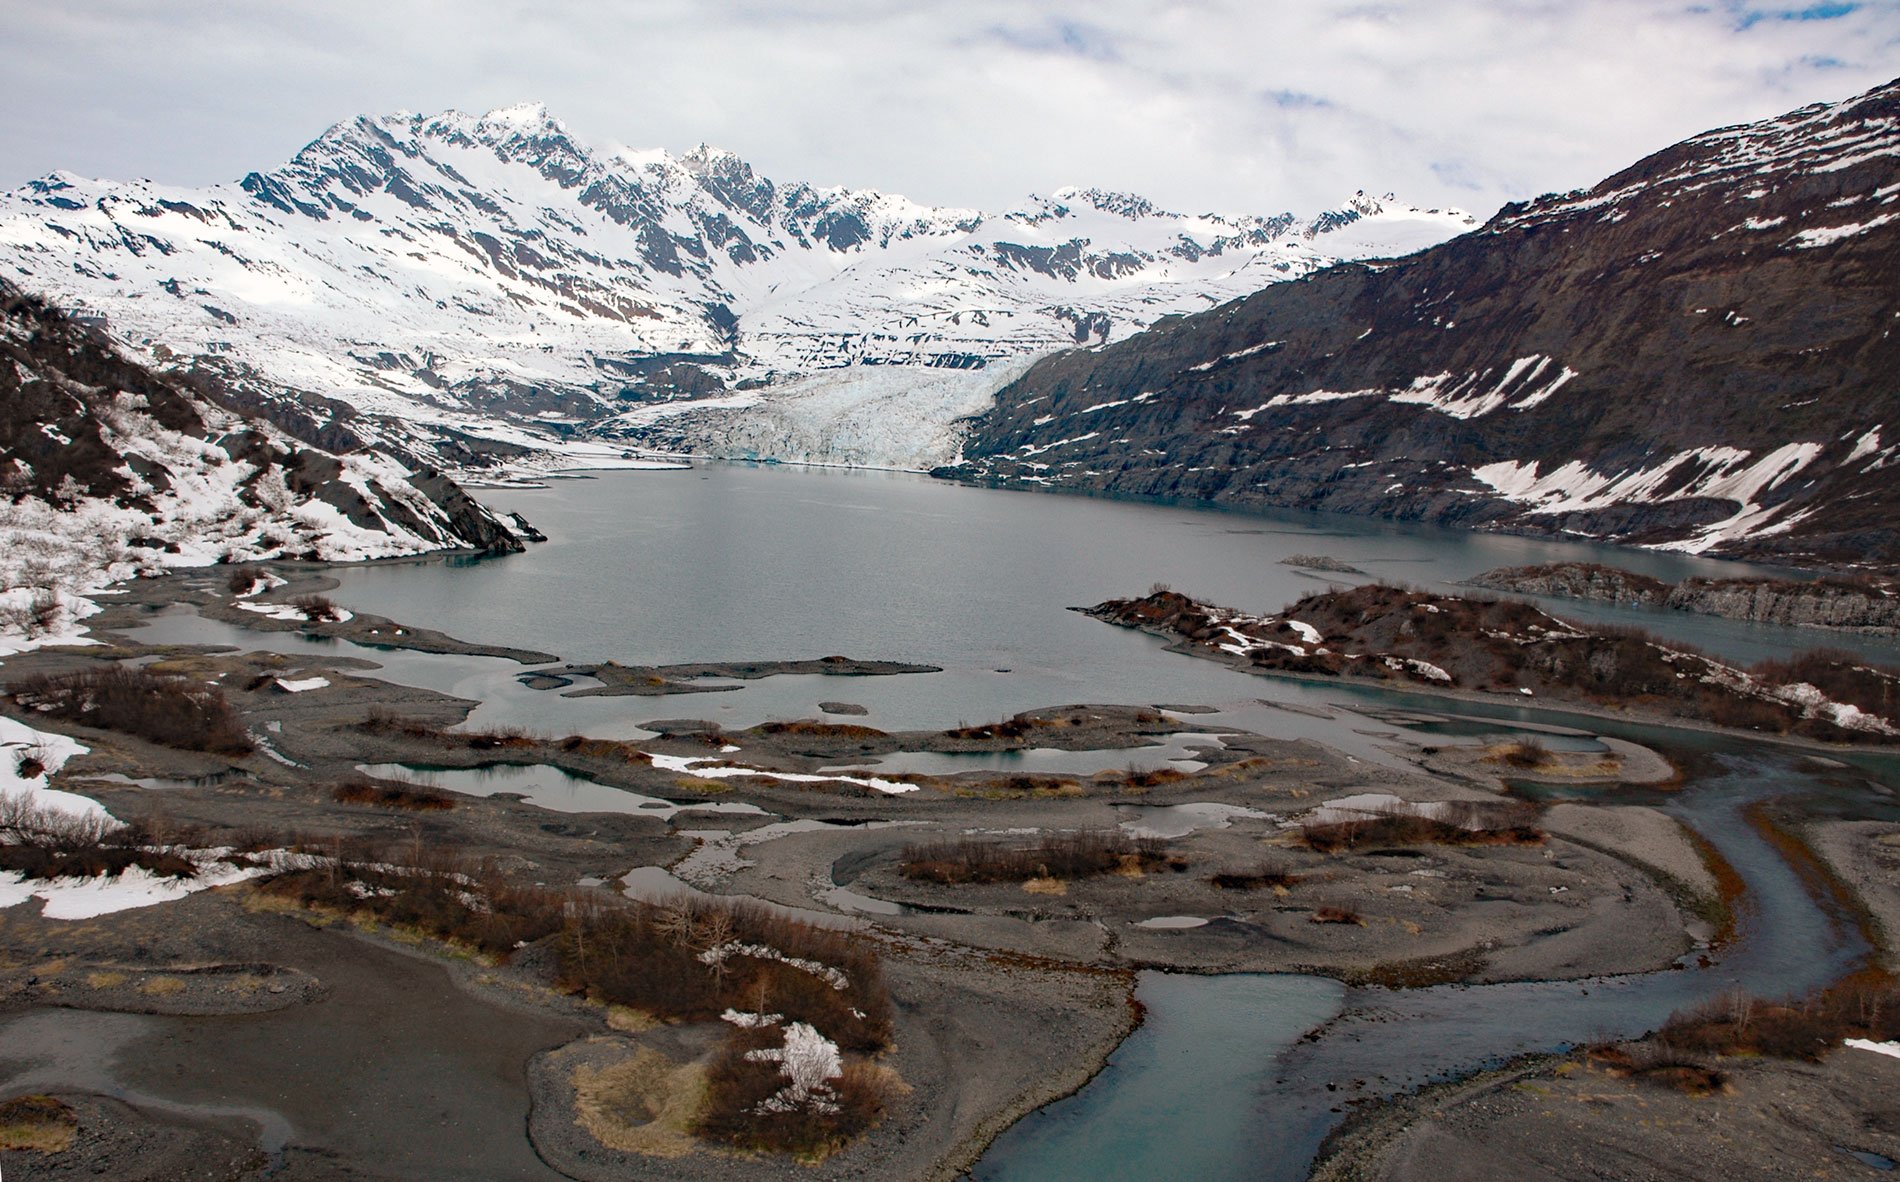
Shoup Glacier starts at an elevation of roughly 6,800 feet (2,073 m) in the Chugach Mountains between Mount Shouplina to the west and Mount Logan to the east, and flows 16 miles (26 km) generally south-southwest to Shoup Bay on the northwest shore of Port Valdez in Prince William Sound, about 74 miles (119 km) east-northeast of Whittier and 9 miles (15 km) west of Valdez, Alaska. The glacier was originally named Canyon Creek Glacier in 1898 by U.S. Army Captain William R. Abercrombie, but it was locally known as the Shoup Glacier and renamed in 1899. Southern Alaska is composed of a series of geologic terranes with the Southern Margin composite terrane bordering the Gulf of Alaska. Included in this composite terrane are the Chugach-Prince William and Yakutat terranes of the Prince William Sound area. The Chugach-Prince William terrane is a Mesozoic and Cenozoic accretionary prism that is up to 62 miles (100 km) wide and extends for over 1,242 miles (2000 km) from Baranof Island in Southeast Alaska to the Shumagin Islands in Southwest Alaska. The coastal region includes the Late Cretaceous Valdez and Orca Groups, and the bedrock forming Shoup Bay consists of Valdez Group deep-sea fan turbidites partially metamorphosed into greywacke, siltstone, and shale, and local conglomerates and volcanic rocks.
Shoup Glacier had economic importance in the late 1800s and early 1900s by providing ice for the mining settlement at Valdez and the U.S. Army post at Fort Liscum on the southern shore of Port Valdez. At that time the glacier terminus reached tidewater in Shoup Bay and drifting bergs were lifted onto barges and towed to these establishments. Tidewater glaciers terminate in the ocean at either a grounded terminus or floating ice tongue and are known for cyclic advances and retreats. The tidewater glacier cycle is described as a slow advance over the course of centuries, until thinning near the terminus initiates a rapid retreat that completes within decades, stabilizing only when the glacier has retreated into shallow water. In general, the retreat phase of a tidewater glacier can be triggered by changes in climate, but once retreat is initiated, the glacier’s behavior is driven primarily by its geometry. Shoup Glacier has retreated more than 1.9 miles (3 km) since 1909, but in a stepwise fashion starting from a topographic constriction where it was stable for decades, followed by a rapid retreat, and then stabilizing again at the next topographic constriction. This glacier, and a majority of Alaska tidewater glaciers, are still responding to the warming observed since the end of the Little Ice Age.
In Alaska fjords, local tsunamis have caused significant damage and loss of life when they are generated by submarine landslides which are often triggered by large earthquakes. Port Valdez was the location of a tsunami triggered by the 1964 Alaska earthquake which destroyed much of the original town site. The local tsunami was likely generated when a 4,921 feet (1,500 m) long section of the Lowe River delta at the head of Port Valdez failed, causing a submarine landslide that displaced seawater and generating a wave that eyewitness reports estimated to be 23 to 39 feet (7–12 m) high, and it was followed by a second, smaller wave that arrived about 10 minutes after the first. Recent multibeam bathymetry surveys have located the submarine landslide debris field from the delta at the east end of the fjord, and also found a second debris field at the west end of the fjord that indicates a landslide from the moraine at the mouth of Shoup Bay. Because Port Valdez is located over the eastern portion of the Alaskan megathrust, it is not surprising that significant earthquakes have been documented in recorded history, and these are often associated with underwater cable breaks. Collectively, these historical observations suggest that submarine failures are a consistent phenomenon accompanying earthquake ground shaking in Port Valdez. Read more here and here. Explore more of Shoup Glacier and Port Valdez here:

