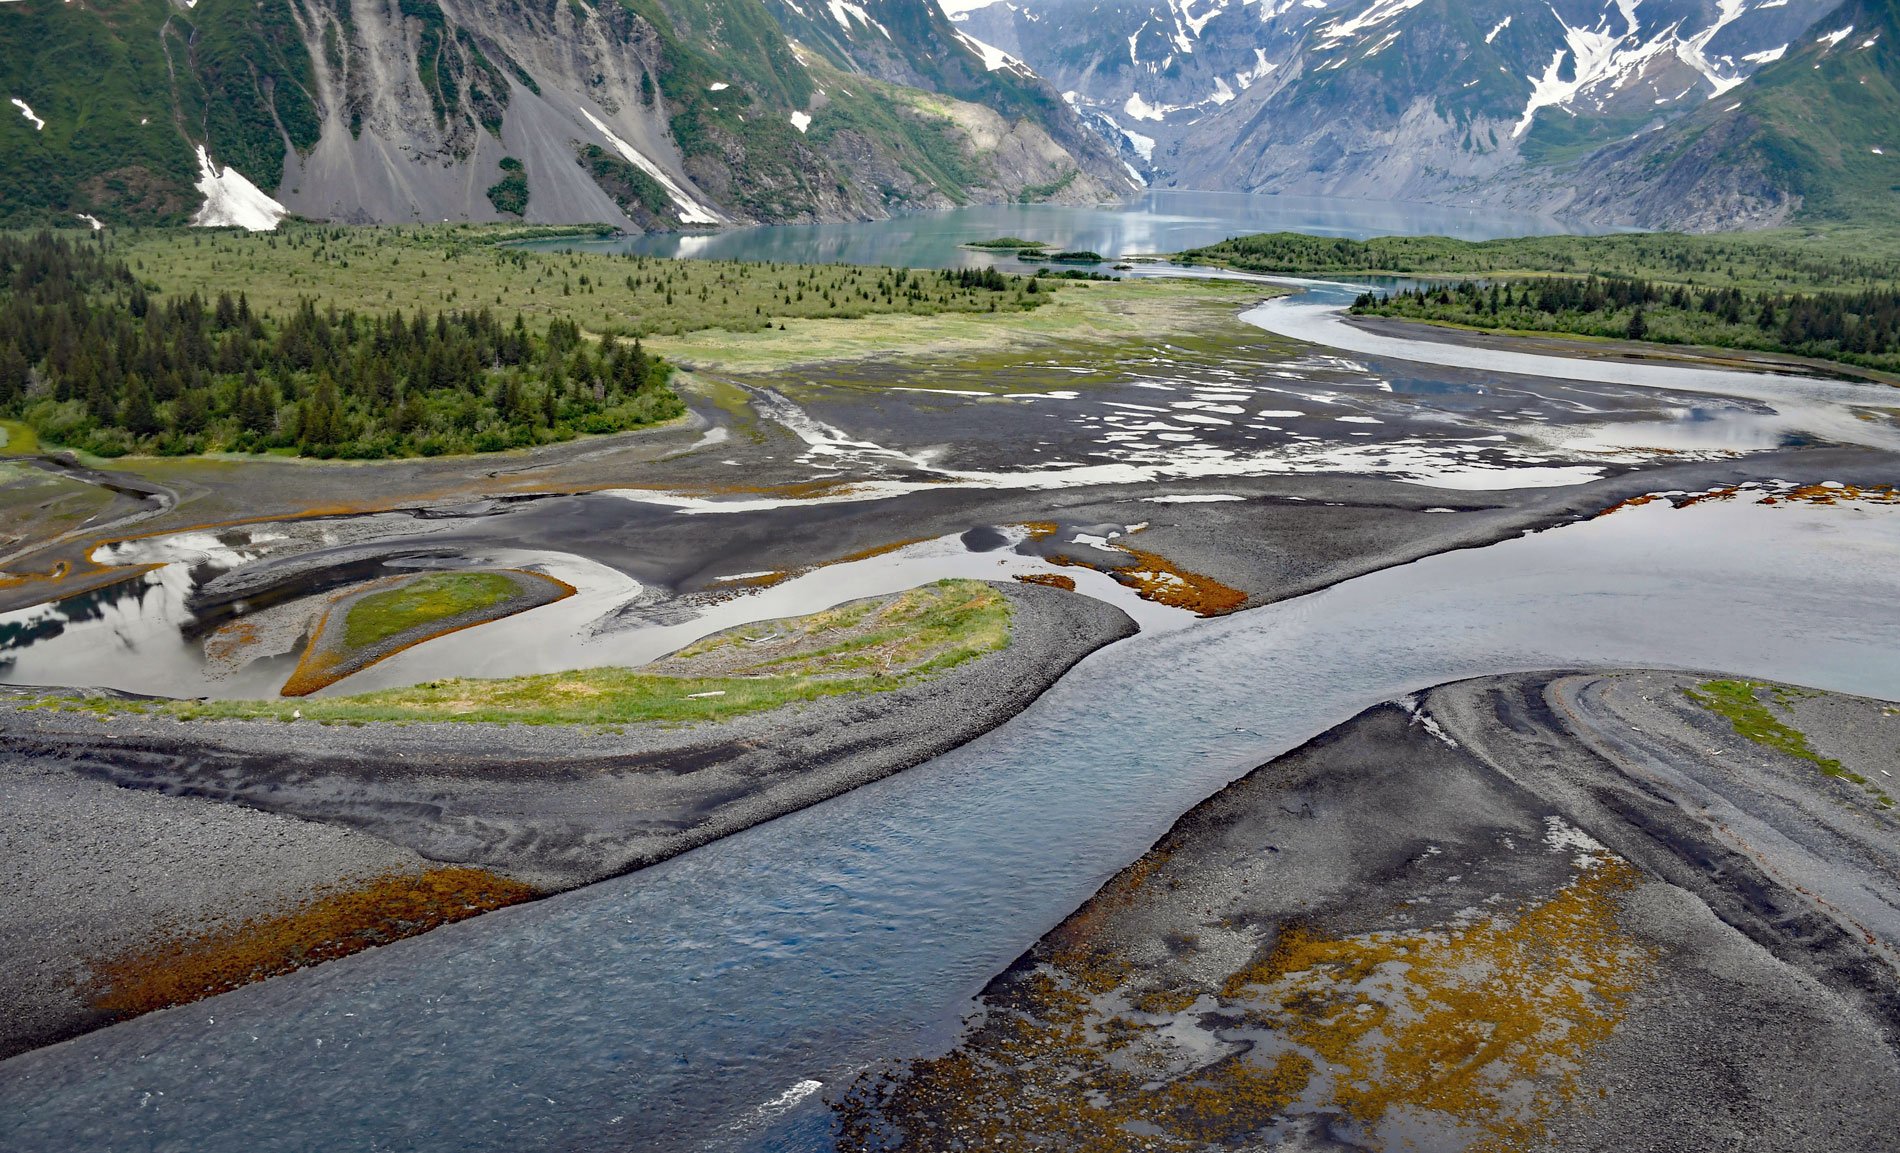
Pedersen Lagoon receives freshwater from proglacial lakes of the Addison and Pedersen glaciers that descend from the Harding Icefield in Kenai Fjords National Park on the western shore of Aialik Bay, about 64 miles (103 km) east-northeast of Homer and 19 miles (31 km) south-southwest of Seward, Alaska. The lagoon was named for Pedersen Glacier, which, in turn, was named in 1908 by Ulysses S. Grant and Daniel F. Higgins of the U.S. Geological Survey for Reverend Louis H. Pedersen, a missionary in Alaska in the late 1800s and early 1900s. The name was originally spelled Pederson on official maps until the U.S. Board on Geographic Names made the correction in 2000. Pedersen Lagoon is formed by a series of recurved spits that developed on top of a terminal moraine complex that represents the maximum glacial extent of Aialik and Pedersen glaciers. Retreat of the glaciers has exposed bedrock representing the Valdez Group, part of the Southern Margin Composite Terrane that developed during the Late Cretaceous and mostly consists of complexly deformed metasedimentary greywacke, siltstone, and shale generally considered to be deposits of turbidity currents in a deep oceanic trench that were lithified and subsequently accreted.
Grant and Higgins estimated that Aialik Glacier started retreating from the submarine terminal moraine in Aialik Bay more than a hundred years prior to their visit. In 1978, the retreat was estimated to have begun around 1800 based on carbon-14 dating of woody debris samples. In 1909, Pedersen Glacier practically filled the lagoon and the terminus position was from 1300 to 1600 feet (400-500 m) behind the moraine, representing the Little Ice Age maximum position. Even then, part of the terminus was reached by tidewater, and Grant and Higgins speculated that the glacier may have been at its maximum position as recently as the early 1890s. By 1950, the glacier had retreated an additional 1300 to 4000 feet (400-1200 m) creating a tidal lagoon. By 1964, another 820 feet (250 m) of retreat had occurred and an ice-marginal lake developed. From 1984 to 1991, Pedersen Glacier advanced roughly 330 feet (100 m) along its centerline and then retreated rapidly, with the proglacial lake lengthening to 2 miles (3.2 km) by 2016. Since then, the retreat rate has decelerated and in 2021, the terminus started emerging from the lake.
Kenai Fjords National Park was established in 1980 to protect temperate rainforests, terrestrial and marine wildlife, historical and archaeological remains, and the unique glacial fjord ecosystems associated with the Harding Icefield. The general rapid retreat of glaciers over the last 100 years resulted in the dense accumulation of ice floes in fjords, which were a navigational hazard for vessels, and thus, limiting marine traffic. Ice floes are also a preferred haul out for harbor seals. The harbor seal is a widely distributed pinniped that routinely hauls out on rocks, beaches, reefs, and ice to rest, give birth to pups, and molt. During the annual molt, the seals haul out more frequently and for longer periods due to the higher energy demands of hair regrowth and benefits of increasing body temperature to facilitate the process. Drifting glacial ice floes seems to be a preferred haul out over terrestrial options, possibly for predator avoidance. Between 1980 and 1989, the number of harbor seals hauled out on ice in front of Aialik Glacier declined by more than 80% and the same general trend has been observed in the Gulf of Alaska; however, despite numerous studies, no definitive cause for the regional decline has been identified. The general retreat of glaciers from tidewater has reduced the number of ice floes available for haul outs, but loss of food, and human disturbance are also likely factors. Read more here and here. Explore more of Pedersen Lagoon and Aialik Bay here:

