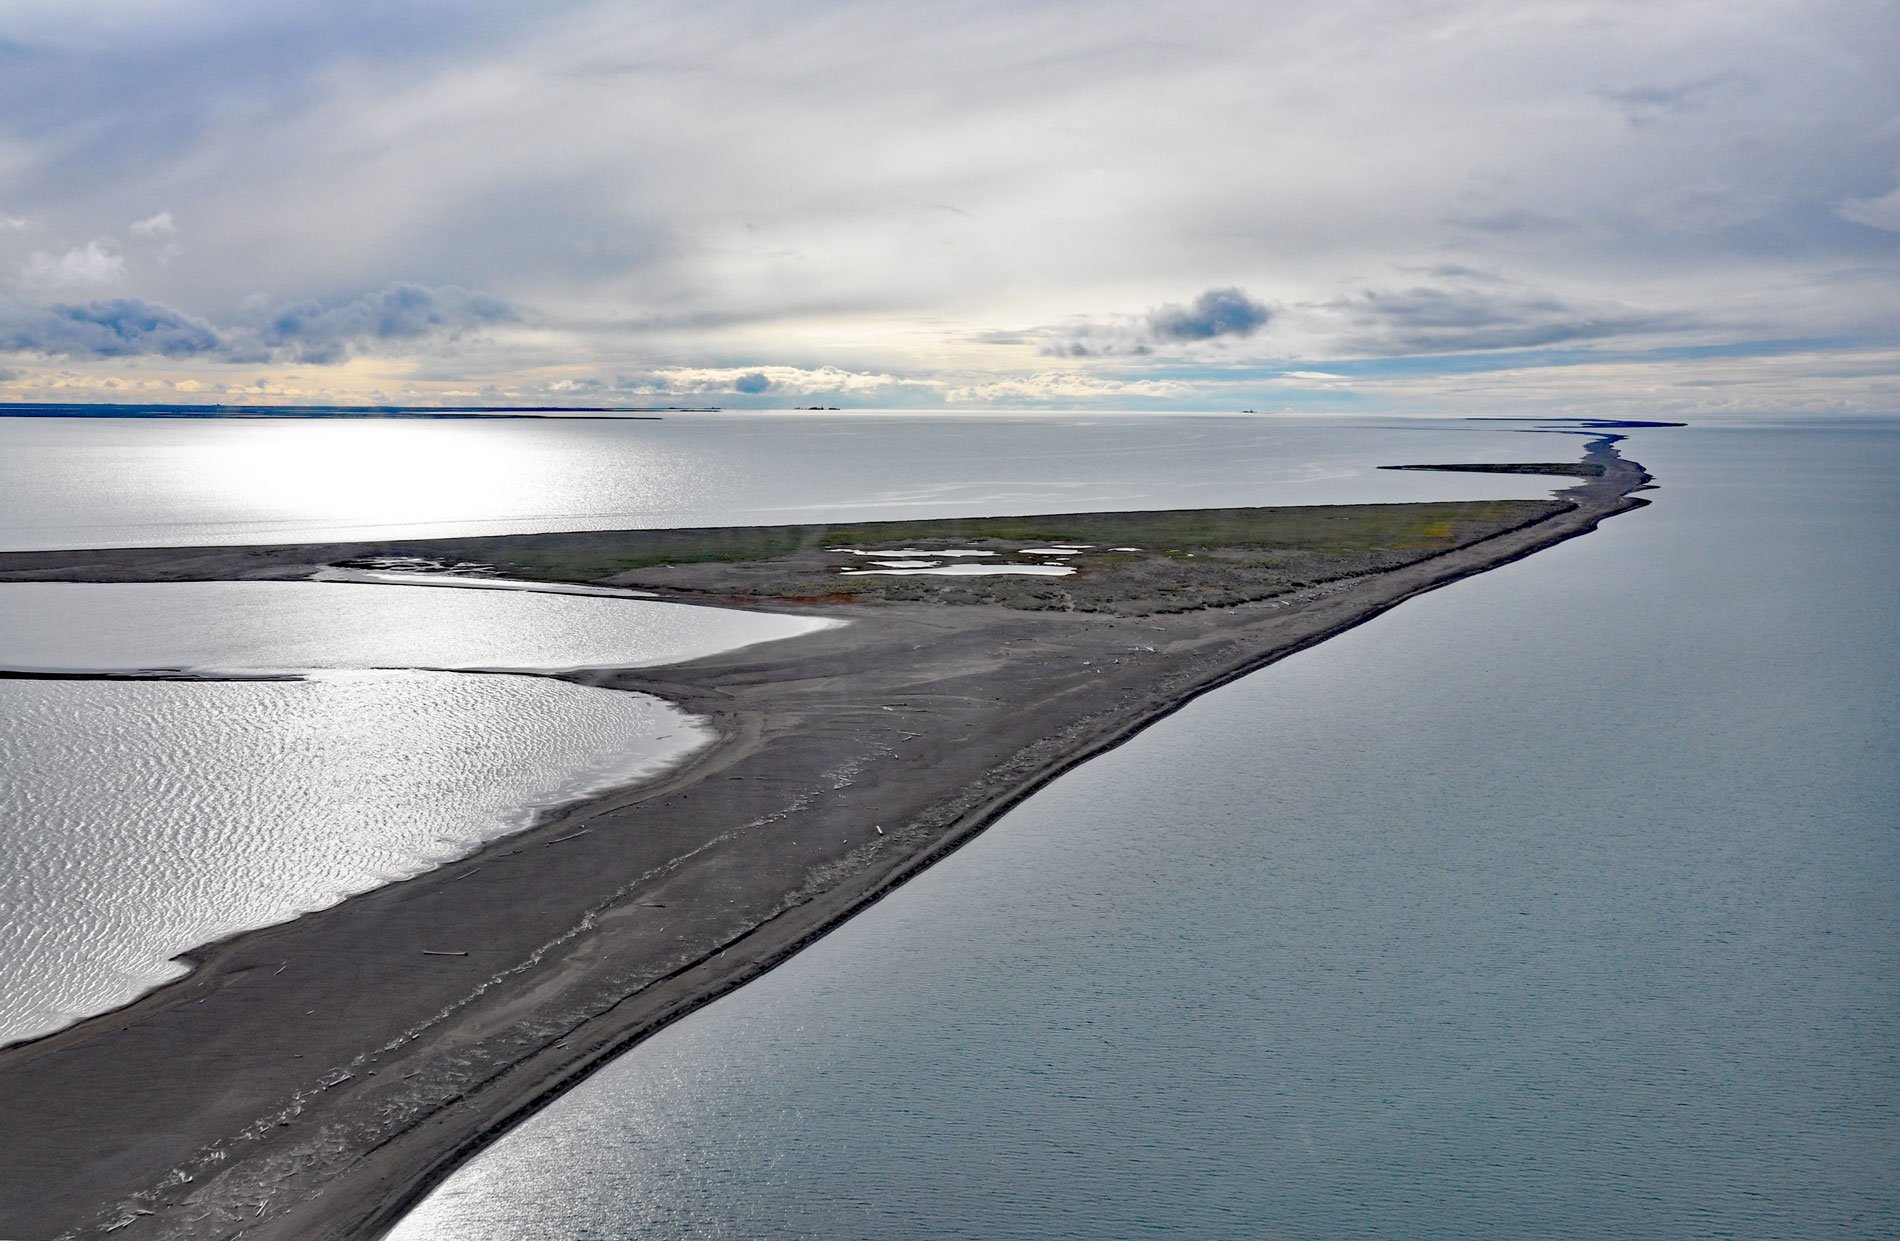
Bodfish Island is part of the Jones Island barrier chain between Cottle Island to the east and Bertoncini Island to the west, separating Simpson Lagoon from the Beaufort Sea, about 178 miles (286 km) southeast of Utqiagvik and 30 miles (48 km) northwest of Deadhorse, Alaska. Bodfish Island was named in 1910 by Ernest de Koven Leffingwell for Hartson H. Bodfish, a prominent New England whaler in the late 19th century. Simpson Lagoon was also named by Leffingwell, after Thomas Simpson of the Hudson’s Bay Company who was involved in an expedition to chart the Arctic coast from 1836 to 1839. Bodfish Island is considered to be a tundra remnant with a permafrost core, formed by detachment from an older relict coastline. The process may be related to the thermal and mechanical erosion of freshwater lakes on the adjacent coastal plain, with this process continuing until an opening is created to the sea and the lake becomes a lagoon. Tidal flushing then accelerates shoreline erosion producing widening the embayment and eventually breaching the outer shore, generating a series of offshore permafrost tundra remnants with points that project into the lagoon.
In the mid-1800s, whaling ships from New England, and particularly Martha’s Vineyard, plied the waters off Africa, South America, Japan and almost anywhere whales could be found. Their cargo and the resulting profits helped build Edgartown and Tisbury where, between 1848 and 1914, 47 whaling captains worked in the Arctic. Many of their names are still common in New England today such as Leavitt, Coffin, Cottle, Fisher, Pease, and Tilton. Some of the names are also common in Alaska. Hartson H. Bodfish was born in 1862 in Tisbury and first went to sea in 1880 on the steam whaling bark Belvedere. His first break came in 1891 as mate on the Mary D. Hume when they caught dozens of whales and reputedly returned with the most profitable voyage in all whaling history. Bodfish also acted as a trader who supplied Arctic whalemen and natives in the area with food, clothing, and other goods, often in return for pelts. He pioneered overwintering in the Arctic with numerous whaling ships such as Herman, Beluga, and Newport, to take advantage of the spring whale migration. He also documented the whaling life through writing and photography, including baseball games at Hershel Island, ivory carvers from Little Diomede, and reindeer herders from Teller and Icy Cape. He retired from whaling and trading by 1920 and in 1936 published a biographical account of his exploits entitled Chasing the Bowhead.
Simpson Lagoon is now part of the Beaufort Lagoon Ecosystems Long Term Ecological Research program to study trophic linkages and food webs in environments that experience extreme seasonal variability, which are now subject to rapid shifts driven by climate change. Barrier island geomorphology exerts a strong control on water exchange between lagoons and the open ocean, and is highly dynamic in the Arctic because sea-ice effects are superimposed on the effects of currents, sea level and waves. Connections between inputs from land and lagoon ecosystems are more direct, and water exchanges between lagoons and the open ocean are more variable than is typical of lower latitude systems. Specific study sites are located in Elson Lagoon, Simpson Lagoon and Stefansson Sound, and Kaktovik and Jago lagoons. The program is being operated in collaboration with the Arctic National Wildlife Refuge. The program includes seasonal field work during ice covered, ice break-up, and open water periods and also includes sensor deployments for continuous measurements of key biogeochemical and hydrographic parameters. These studies will provide information and improve understanding of how climate variability, permafrost thaw, shifting precipitation regimes, and losses of sea ice affect lagoon ecosystems. Read more here and here. Explore more of Bodfish Island and Simpson Lagoon here:

